A while ago I helped a colleague, Vadim, debug a performance issue with TensorFlow in an unexpected location. I thought this was a bit interesting so I've been meaning to share it; here's a rough post of the details.
1. The Expert's Eye
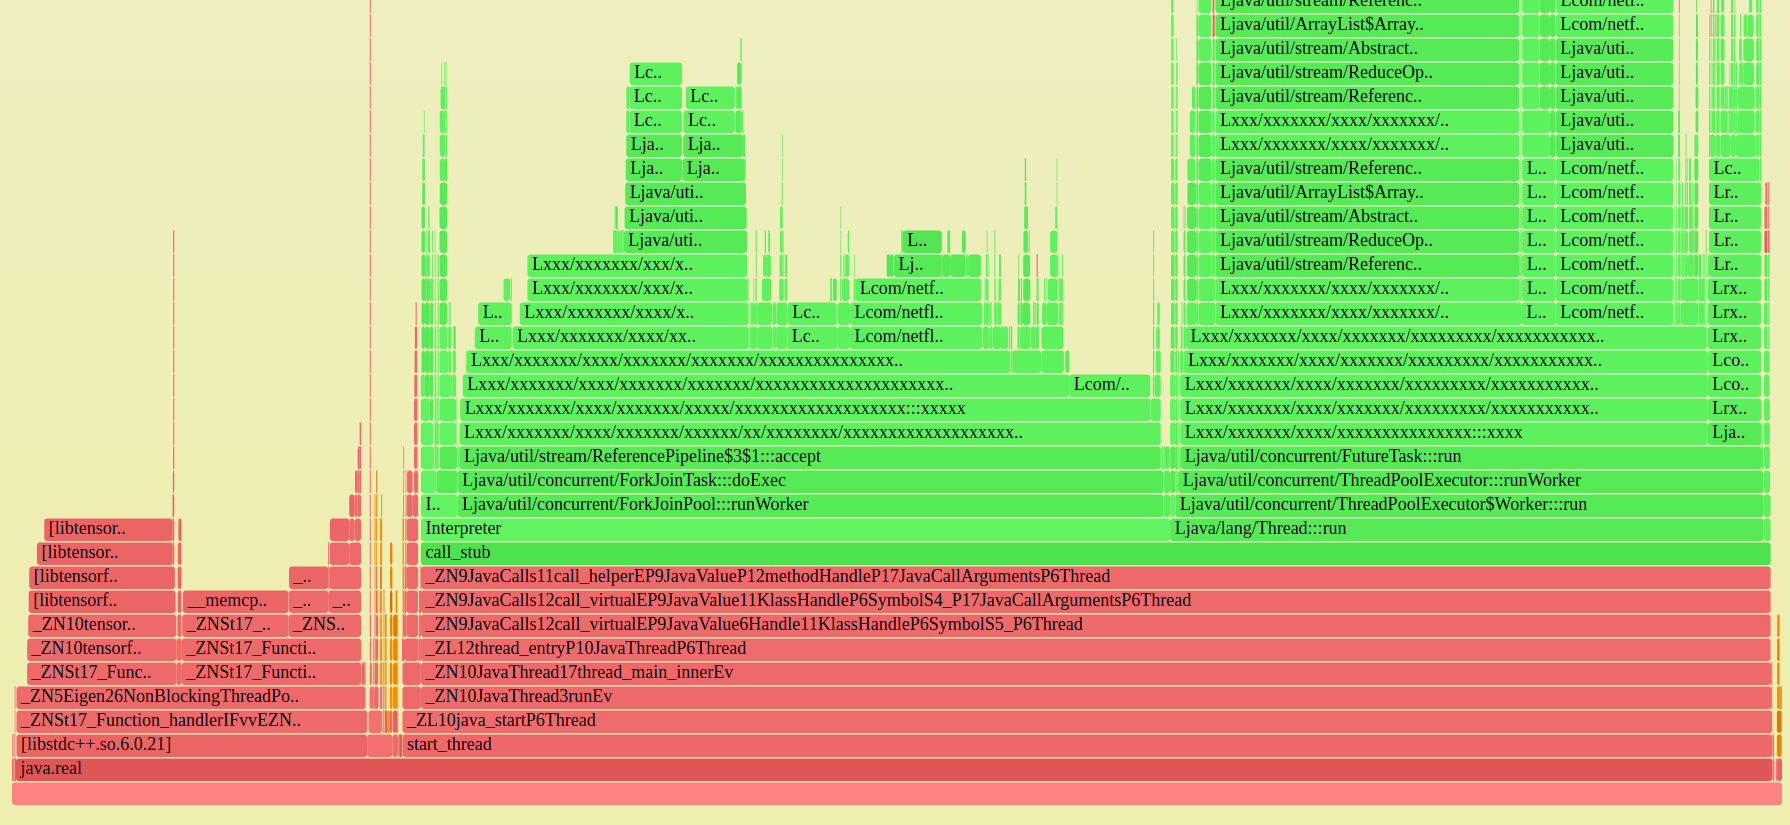
Vadim had spotted something unusual in this CPU flamegraph (redacted); do you see it?:

I'm impressed he found it so quickly, but then if you look at enough flame graphs the smaller unusual patterns start to jump out. In this case there's an orange tower (kernel code) that's unusual. The cause I've highlighted here. 10% of total CPU time in page faults.
At Netflix, 10% of CPU time somewhere unexpected can be a large costly issue across thousands of server instances. We'll use flame graphs to chase down the 1%s.
2. Why is it Still Faulting?
Browsing the stack trace shows these are from __memcpy_avx_unaligned(). Well, at least that makes sense: memcpy would be faulting in a data segment mappings. But this process had been up and running for hours, and shouldn't still be doing so much page fault growth of its RSS. You see that early on when segments and the heap are fresh and don't have mappings yet, but after hours they are mostly faulted in (mapped to physical memory) and you see the faults dwindle.
Sometimes processes page fault a lot because they call mmap()/munmap() to add/remove memory. I used my eBPF tools to trace them (mmapsnoop.py) but there was no activity. So how is it still page faulting?
Is it doing madvise() and dropping memory? A search of madvise in the flame graph showed it was 0.8% of CPU, so it definitely was, and madvise() was calling zap_page_range() that was calling the faults. (Click on the flame graph and try Ctrl-F searching for "madvise" and zooming in.)
3. Premature Optimization
I read the kernel code related to madvise() and zap_page_range() from mm/advise.c. That showed it calls zap_page_range() for the MADV_DONTNEED flag. (I could have also traced sys_madvise() flags using kprobes/tracepoints).
This seemed to be a premature optimization gone bad: The allocator was calling dontneed on memory pages that it did in fact need. The dontneed dropped the virtual to physical mapping, which would soon afterwards cause a page fault to bring the mapping back.
4. Allocator Issue
I suggested looking into the allocator, and Vadim said it was jemalloc, a configure option. He rebuilt with glibc, and the problem was fixed!
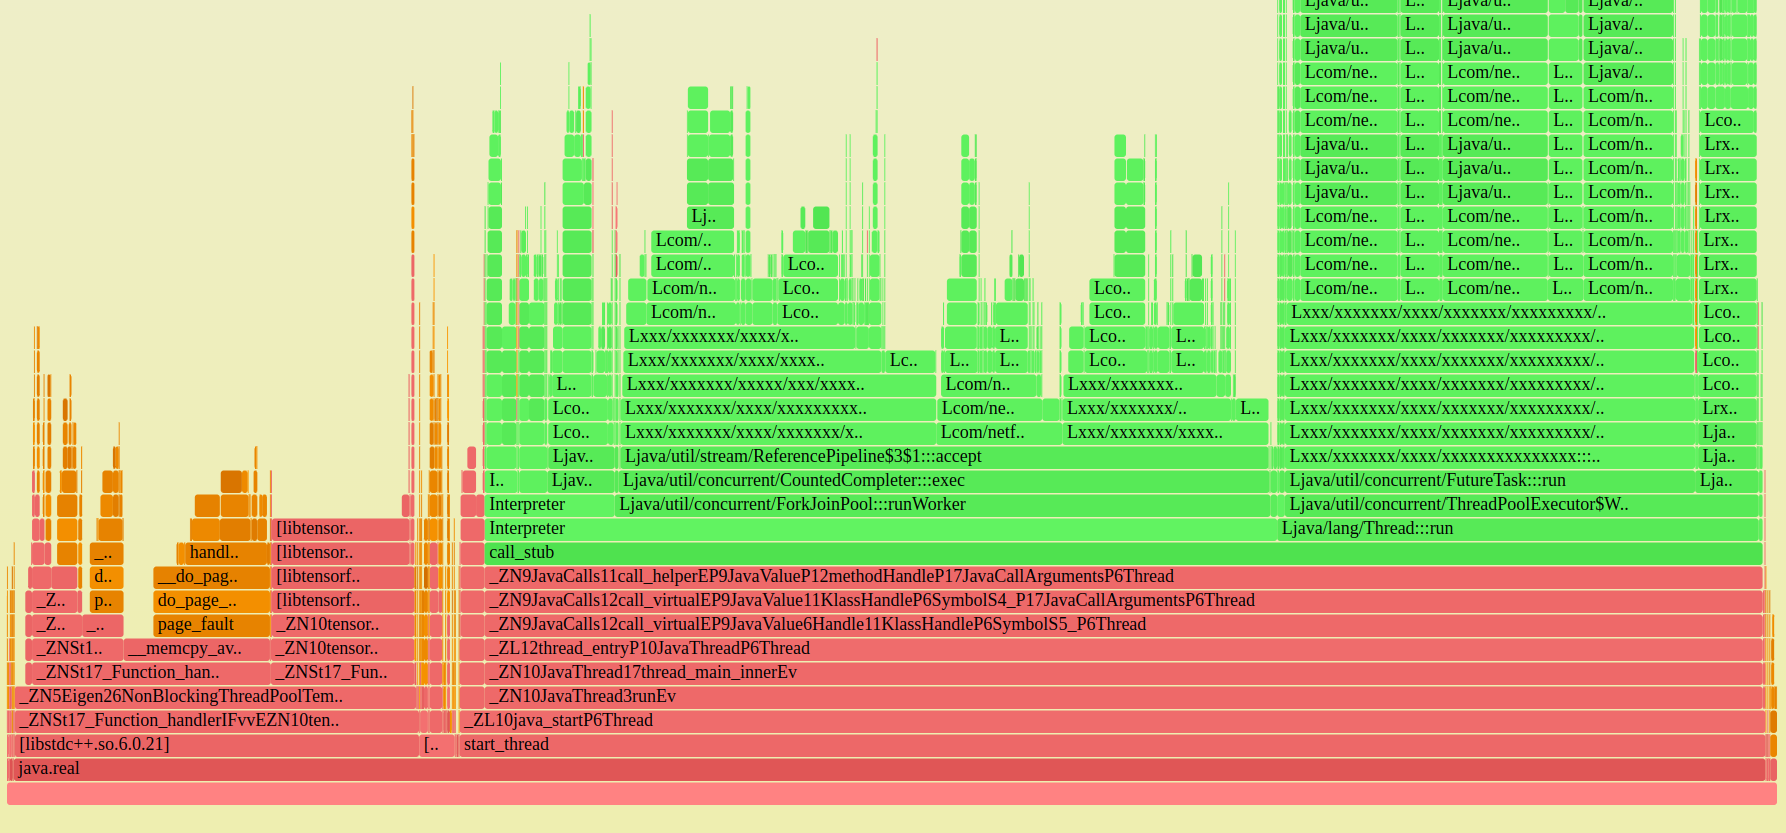
Here's the fixed flame graph:

Initial testing showed only a 3% win (can be verified by the flame graphs). We were hoping for 10%!
如有侵权请联系:admin#unsafe.sh