2021-4-11 05:22:0 Author: www.boredhackerblog.info(查看原文) 阅读量:4 收藏
Introduction
I was doing some research around detection related to maldoc/initial access. Usually, I've seen malicious Word or Excel documents and in some cases compressed files containing Word document, Excel document, script, or an executable. In a lot of cases LOLBIN/LOLBAS are abused. You can see this this happening a lot of sandbox (anyrun, VT dynamic, hatching triage, etc..) outputs as well.
I came across some guidance around blocking some LOLBIN/LOLBAS files with Windows Firewall to prevent some of the initial compromise activity. There multiple scripts and blog posts related to this. Essentially, Windows Firewall rules are added to prevent some of the executables from connecting to the internet.
Scripts/Blogs:
https://daniel.streefkerkonline.com/2017/10/24/mitigate-commodity-malware-attacks-with-windows-firewall-rules/
https://call4cloud.nl/2020/07/the-windows-firewall-rises/
https://gist.github.com/ricardojba/ecdfe30dadbdab6c514a530bc5d51ef6#file-windows_hardening-cmd-L497
https://gist.github.com/jaredhaight/e88b4323adce06395dace501841d3075#file-windows_hardening-cmd-L108
I also saw posts where Olaf Hartong was discussing data from sandbox related to malware and LOLBIN/LOLBAS usage and rundll32 as well.
https://twitter.com/olafhartong/status/1359235339332780034
https://twitter.com/olafhartong/status/1361415502447267842
I thought it would be interesting to collect data on my own and have my own dataset to play with. I also wanted the ability to test malware in an environment where some hardening was applied, such as mentioned in the blog posts and scripts above. In addition to that, I wanted to have the ability to have an EDR agent or AV agent in the same sandbox to see what it collects or alerts on in it's management console. I ended up writing vmexec to help me with this.
vmexec is similar to cuckoo sandbox and cape sandbox but it doesn't get any information back from the VM's. It just puts the executable in the VM and executes it. When you upload the sample, you can pick a VM or use any available VM and set how long the VM will run for after the sample is uploaded. It uses virtualbox for VM's and just like cuckoo or cape, you need to have an agent inside the VM.
https://github.com/BoredHackerBlog/vmexec
Design
I'll be using Windows 10 VM with various logging enabled and sysmon installed. I'm using sysmon-module rules (https://github.com/olafhartong/sysmon-modular).
For forwarding logs, I'll be using winlogbeat OSS. (https://www.elastic.co/downloads/beats/winlogbeat-oss) I'm using OSS version because I'll be using Opendistro for elasticsearch elastic and kibana containers. (https://opendistro.github.io/for-elasticsearch/)
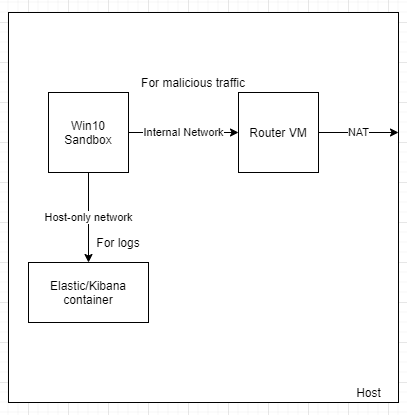
Since I'll be running malware, I'll have to have a second VM for routing the malicious traffic but it's not required if you're okay with threat actors potentially seeing your connections. You can always set up the sandbox VM in a way it doesn't route any traffic as well.
The network and VM design kinda looks like this:
Setup
Getting all the packages and dependencies:
- Install Ubuntu 20.04 (although pretty much any Linux OS should work)
- Install Docker (https://get.docker.com/)
- Install docker-compose (https://docs.docker.com/compose/install/)
- Install Virtualbox (https://linuxize.com/post/how-to-install-virtualbox-on-ubuntu-20-04/)
- Make sure python3 and python3-pip are installed
- Might have to run apt install python3 python3-pip
- Install python packages
- Run the commands below:
- pip3 install flask
- pip3 install flask-sqlalchemy
- pip3 install flask-admin
- Download vmexec https://github.com/BoredHackerBlog/vmexec
- if you have git installed you can run:
- git clone https://github.com/BoredHackerBlog/vmexec
Getting Elastic and Kibana up and running:
I'm using a docker-compose file for elastic and kibana.
[email protected]:~/elk$ cat docker-compose.yml
version: '3'
services:
odfe-node1:
image: amazon/opendistro-for-elasticsearch:1.13.1
container_name: odfe-node1
environment:
- discovery.type=single-node
- bootstrap.memory_lock=true # along with the memlock settings below, disables swapping
- "ES_JAVA_OPTS=-Xms512m -Xmx512m" # minimum and maximum Java heap size, recommend setting both to 50% of system RAM
ulimits:
memlock:
soft: -1
hard: -1
nofile:
soft: 65536 # maximum number of open files for the Elasticsearch user, set to at least 65536 on modern systems
hard: 65536
volumes:
- odfe-data1:/usr/share/elasticsearch/data
ports:
- 9200:9200
networks:
- odfe-net
kibana:
image: amazon/opendistro-for-elasticsearch-kibana:1.13.1
container_name: odfe-kibana
ports:
- 5601:5601
expose:
- "5601"
environment:
ELASTICSEARCH_URL: https://odfe-node1:9200
ELASTICSEARCH_HOSTS: https://odfe-node1:9200
networks:
- odfe-net
volumes:
odfe-data1:
networks:
odfe-net:
In the docker-compose.yml file shown above, the data is being stored in odfe-data1 volume. When you take down the containers and bring them up again, the data will not go away.
Additional information about opendistro for elastic docker container and settings can be found here: https://opendistro.github.io/for-elasticsearch-docs/docs/install/docker/
Cd into the directory that contains the docker-compose.yml file and run docker-compose up -d to start containers in the background. To take down the containers, you can run docker-compose down from the same directory.
Once you bring up the containers, elastic will be running on port 9200 and kibana will be on 5601.
Setting up Windows 10 Sandbox
- Create a Windows 10 VM in virtualbox
- Disable updates
- Disable antivirus
- Disable UAC
- Disable anything else that's not needed
- Install whatever applications you need, such as a pdf reader or Office
- If you're using Office (Word or Excel), ensure to allow macros to run automatically (https://support.microsoft.com/en-us/topic/enable-or-disable-macros-in-office-files-12b036fd-d140-4e74-b45e-16fed1a7e5c6)
- Install Python 3+
- Copy agent.py from vmexec project into the VM (do not run it yet)
These should help with disabling of some things: https://github.com/BoredHackerBlog/LogDetectionLab/blob/main/change_sec_config.bat
https://github.com/BoredHackerBlog/loggingstuff/blob/main/loggingstuff.bat
Setting up logging and log forwarding:
- Download sysmon and install Sysmon with sysmon-module rules (see the loggingstuff.bat link above)
- Enable process auditing and powershell logging (https://redblueteam.wordpress.com/2020/02/08/enable-command-line-and-powershell-audit-for-better-threat-hunting/)
- Download and install winlogbeat oss
- configure winlogbeat oss to forward logs to 192.168.56.1, which is where elastic will be running once we create host-only adapter
After the base VM is setup, there are some network modifications that are needed.
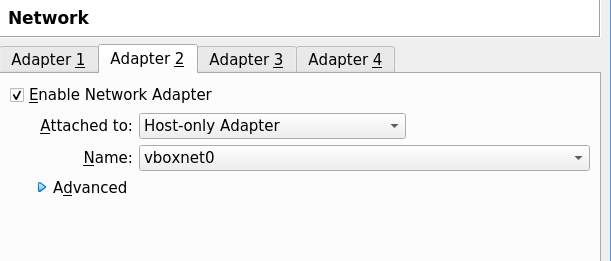
You will need to create a host-only adapter without dhcp server enabled.
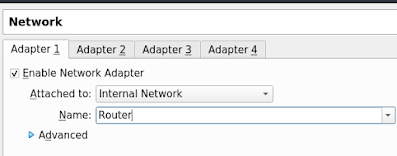
Set the first NIC/adapter to NAT or internal network or whatever else. I have mine setup to internal network going to my router.
Finally, turn on the VM, set a static IP for the adapter in Windows. Since my vboxnet0 host-only adapter is using 192.168.56.1/1 I set my IP to 192.168.56.2.
Reboot the VM, login and run agent.py and take a snapshot while the VM is running. Note the IP address, snapshot name, and VM name.
Setting up vmexec
in app.py, just search for #CHANGEME and modify the settings there.
You'll want to add your VM like this:
db.session.add(VMStatus(name="winVM",ip="10.0.0.178",snapshot="Snapshot2", available=True))
name is the name you gave your VM in virtualbox, IP is the static IP that was assigned, and snapshot is the snapshot you're utilizing.
Usage
To start using vmexec, you need the docker containers for elastic and kibana running (cd into the directory with your docker-compose.yml file and type docker-compose up -d), you need your router VM up and running. You can just start the VM. Finally, you need to start vmexec. cd into the vmexec directory and type flask run -h 0.0.0.0 (if you want to remotely access the web server) the web server will be running on port 5000.
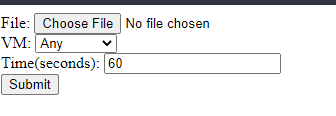
the webui looks like this:
You can select and upload a file, select a specific VM from the dropdown menu (optional), and change the VM run time and click the submit button.
You can access kibana on port 5601 via web browser. Make sure to setup your index pattern. It should be winlogbeat-*.
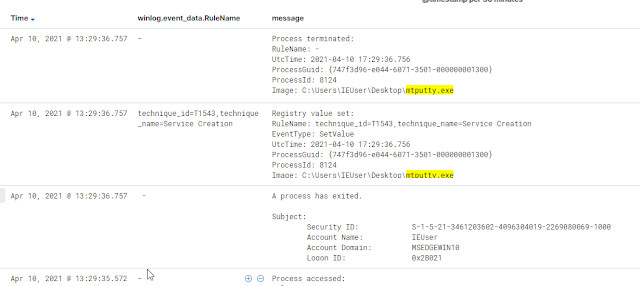
In kibana you can search for the executable file that was ran and look at surrounding events. With sysmon-modular rules, you can also match events with mitre framework.
Modifying the project
Modifying the project is easy depending on your needs. Agent.py can be modified easily if you would like to upload files to specific location or execute/open them in a certain way. There could be code added in vm_process function as well if additional steps need to be taken before running the VM or the file or after.
Resources
https://cuckoosandbox.org/
https://github.com/kevoreilly/CAPEv2
https://github.com/BoredHackerBlog/capev2-virtualbox-install
https://github.com/BoredHackerBlog/vmexec
https://www.docker.com/
https://opendistro.github.io/for-elasticsearch/
https://www.elastic.co/downloads/beats/winlogbeat-oss
https://github.com/olafhartong/sysmon-modular
https://www.virtualbox.org/
如有侵权请联系:admin#unsafe.sh


