
Loading...


Website performance is crucial to the success of online businesses. Study after study has shown that an increased load time directly affects sales. In highly competitive markets the performance of a website is crucial for success. Just like a physical shop situated in a remote area faces challenges in attracting customers, a slow website encounters similar difficulties in attracting traffic. It is vital to measure and improve website performance to enhance user experience and maximize online engagement. Results from testing at home don’t take into account how your customers in different countries, on different devices, with different Internet connections experience your website.
Simply put, you might not know how your website is performing. And that could be costing your business money every single day.
Today we are excited to announce Cloudflare Observatory - the new home of performance at Cloudflare.
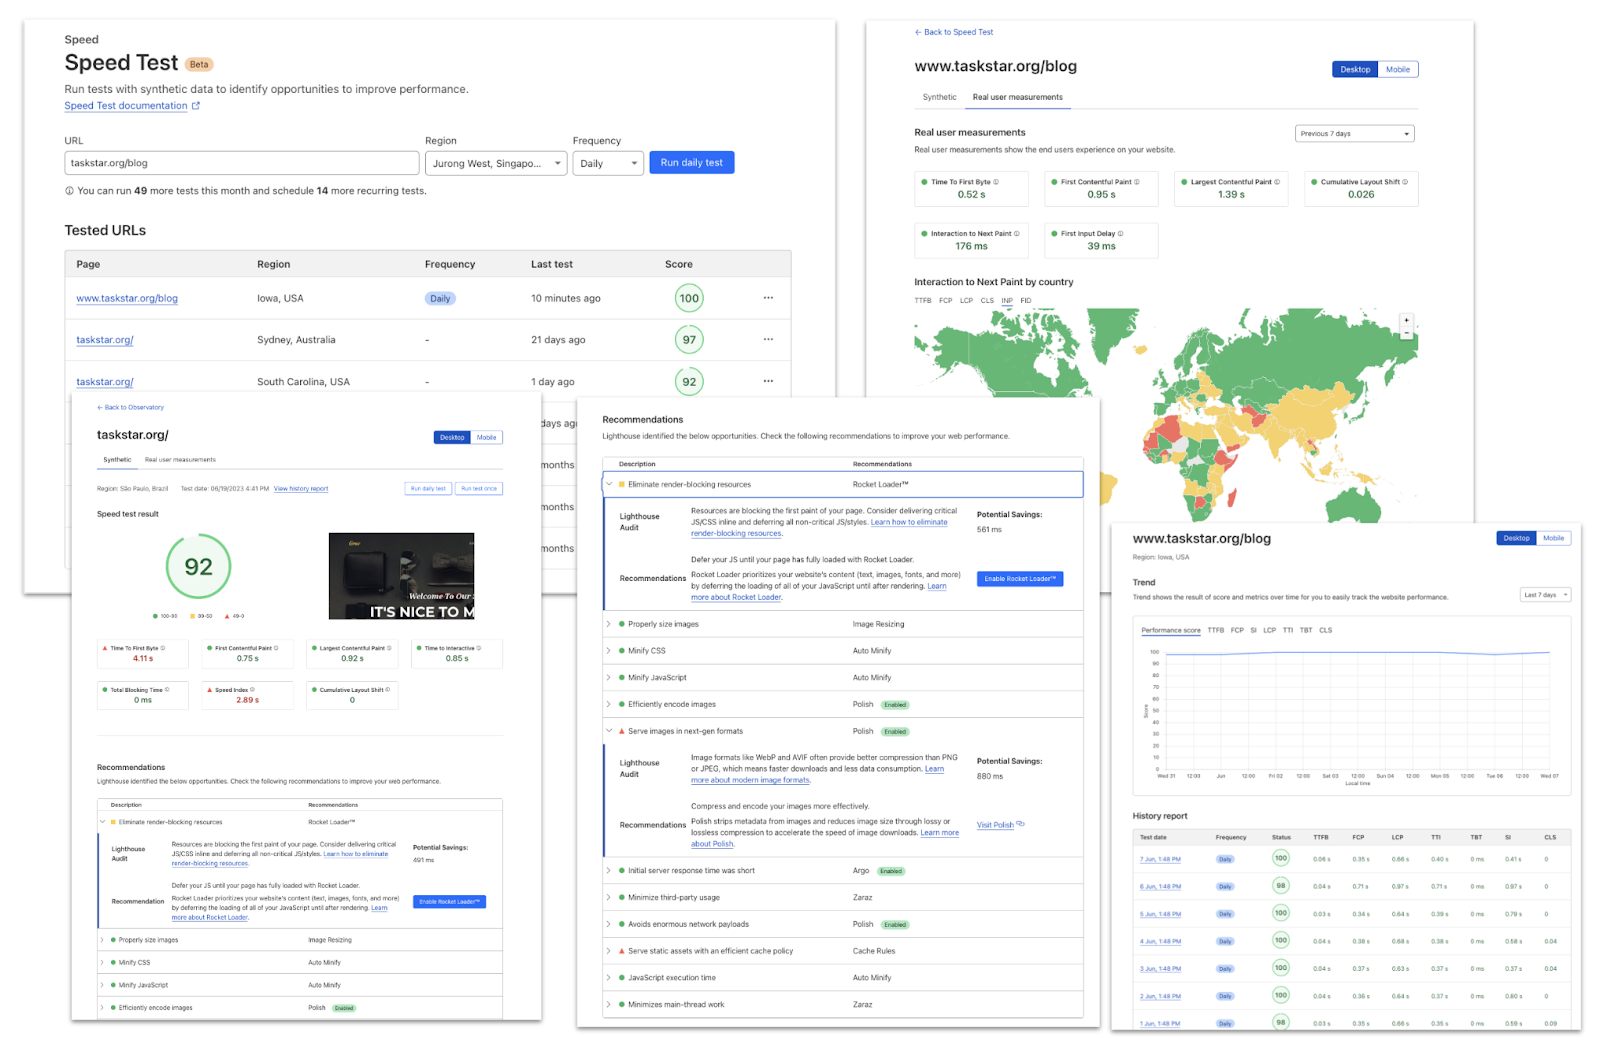
Cloudflare users can now easily monitor website performance using Real User Monitoring (RUM) data along with scheduled tests from different regions in a single dashboard. This will identify any performance issues your website may have. The best bit? Once we’ve identified any issues, Observatory will highlight customized recommendations to resolve these issues, all with a single click.
Making your website faster just got a lot easier.
I feel the need. The need for speed!
Having a fast website is crucial for achieving online success. According to Google, even a one-second improvement in load time can boost mobile conversions by up to 27%.
A study from Deloitte found “With a 0.1s improvement in site speed, we observed that retail consumers spent almost 10% more”. Another study, from Google, found “53% will leave a mobile site if it takes more than 3 seconds to load”. There is a very real link between website performance and business success.
In today's digital landscape, customers expect instant access to information and seamless browsing experiences. We have all encountered the frustration of waiting for a website to load, often leading us to click the back button and click on the next link. For ecommerce sites, this delay directly translates to lost revenue as users quickly navigate elsewhere.
This importance is further amplified in the world of Search Engine Optimization (SEO). In May 2021, Google announced that page speed would be incorporated into their ranking algorithm, highlighting the significance of fast-loading web pages for higher search engine rankings.
Introducing Observatory
In 2019, we launched the new Speed Tab with the mission to address two crucial questions: "How fast is my website after moving to Cloudflare?" and "How fast could it be?" This tab allowed customers to compare their website's performance before and after enabling Cloudflare features. However, it required users to delve into analytics and analyze traffic patterns and cache hit ratios to optimize their sites, which proved challenging for new Cloudflare users.
To address this, we developed Observatory, a fresh approach to performance monitoring at Cloudflare. Observatory fills the gap that previously existed in understanding website performance and simplifies the process of addressing performance issues by providing tailored recommendations.
Observatory integrates Real-User Monitoring (RUM) data, which enables users to understand their website's performance as experienced by their end users across the globe. By leveraging RUM data we can show valuable insight into the areas of the website that can be optimized and surface Cloudflare features and functionality that can address these issues.
Additionally, Observatory incorporates Google Lighthouse, the industry standard tool for evaluating web performance. We replaced WebPageTest with Lighthouse due to its versatility and widespread adoption in the performance community. With Lighthouse, users can run, schedule, and access Lighthouse performance reports directly in the Cloudflare dashboard.
Observatory also enables regional testing, recognizing the importance of understanding performance variations across different locations. By simulating website performance in different regions, users can understand if their webpage performs well in certain countries and poorly in others. This enables users to optimize their websites for a global audience, ensuring consistent and fast user experiences regardless of location.
Observatory becomes your unified place within the Cloudflare dashboard for website performance by bringing together RUM data, Lighthouse insights, and regional testing. Users can gain a comprehensive understanding of their website's performance and implement Cloudflare recommendations based on this data with just a click of a button.
Measuring performance in Cloudflare Observatory
We support the two main methods of testing website performance. These are synthetic tests and Real User Monitoring (RUM) tests.
Synthetic tests involve simulating user interactions and monitoring performance under controlled environments. These tests can provide valuable baseline measurements and help identify potential issues before deploying changes.
On the other hand, RUM tests involve collecting data directly from real users as they interact with the website, capturing their actual experiences in different environments and network conditions. RUM tests offer insights into the true end-user perspective. By combining both synthetic and RUM tests, website owners can gain a holistic view of performance, understanding how changes and optimizations affect both simulated and real user experiences.
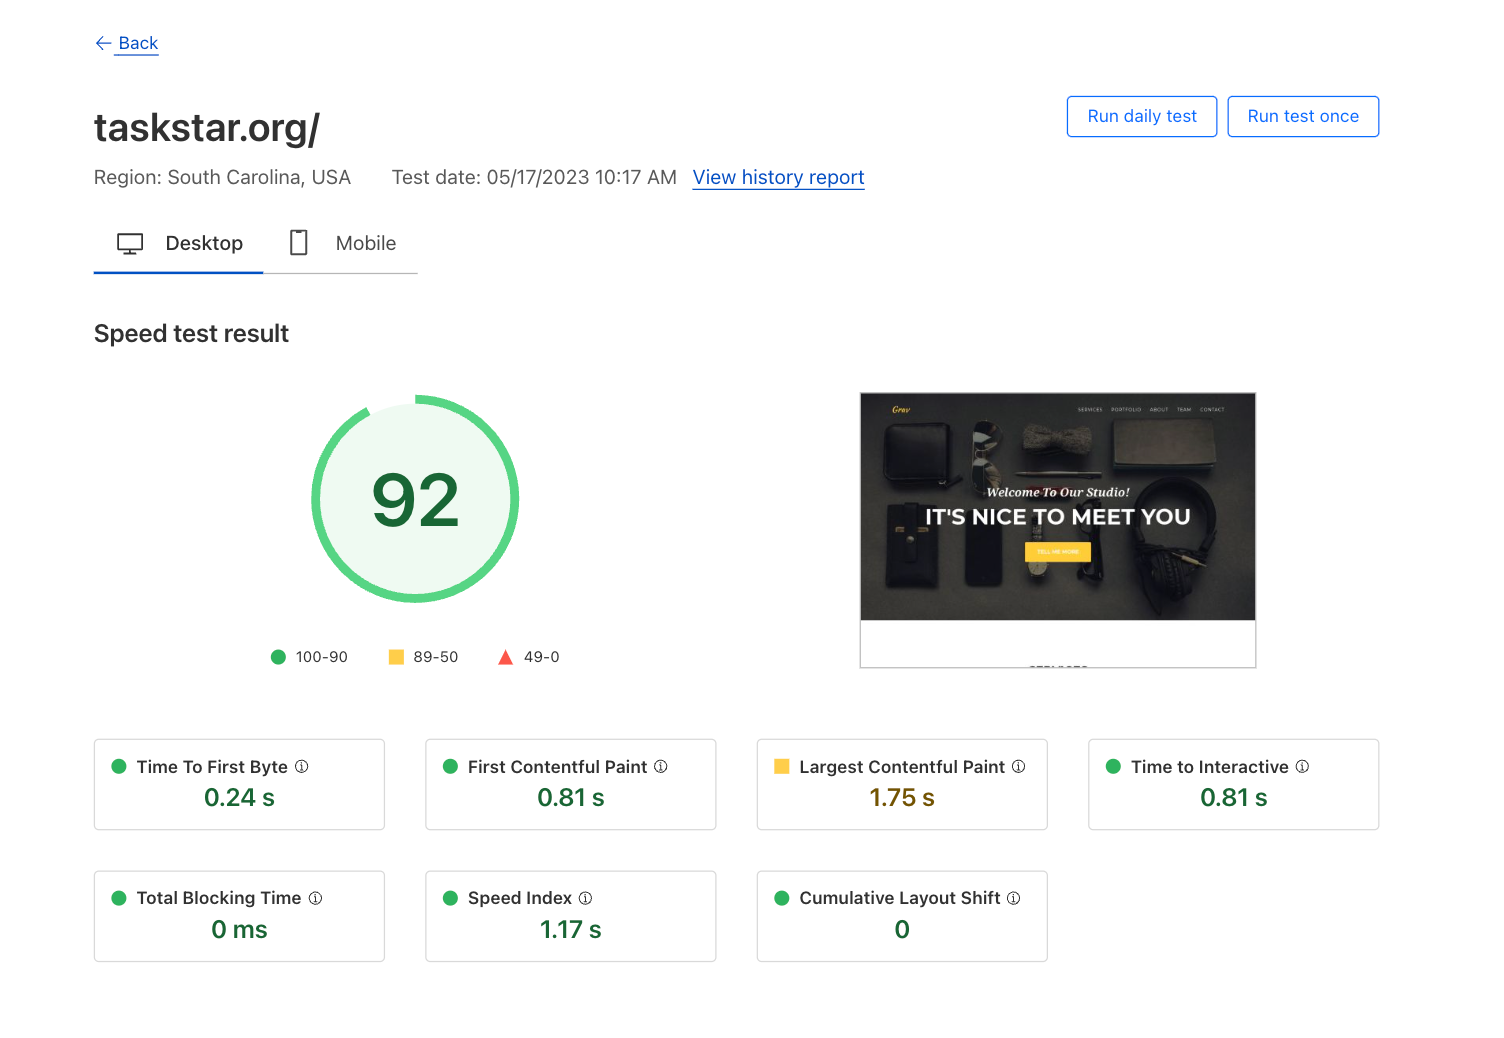
Cloudflare Observatory combines both of these in one location. The integration of Google Lighthouse within the Observatory gives Cloudflare users a simple way to synthetically measure and understand their site's performance. Google Lighthouse measures several key performance metrics that impact user experience and search engine ranking. The generated report provides an overall performance score ranging from 1 (least performant) to 99 (most performant), making it easy for website owners to understand their site's performance.
Observatory offers a user-friendly interface that presents each Lighthouse metric in a traffic light system, indicating the result of the tested metric. One critical metric is Largest Contentful Paint (LCP), which measures a page's loading performance of the primary content. An optimal LCP score is less than 2.5 seconds, indicating satisfactory loading speed for the user. Through Observatory website owners can easily see their LCP score and other metrics. This allows them to optimize their site's performance and user experience. For example, by examining the LCP score website owners can identify opportunities for improvement and make informed decisions to enhance their site's performance.
New Smarter Recommendations
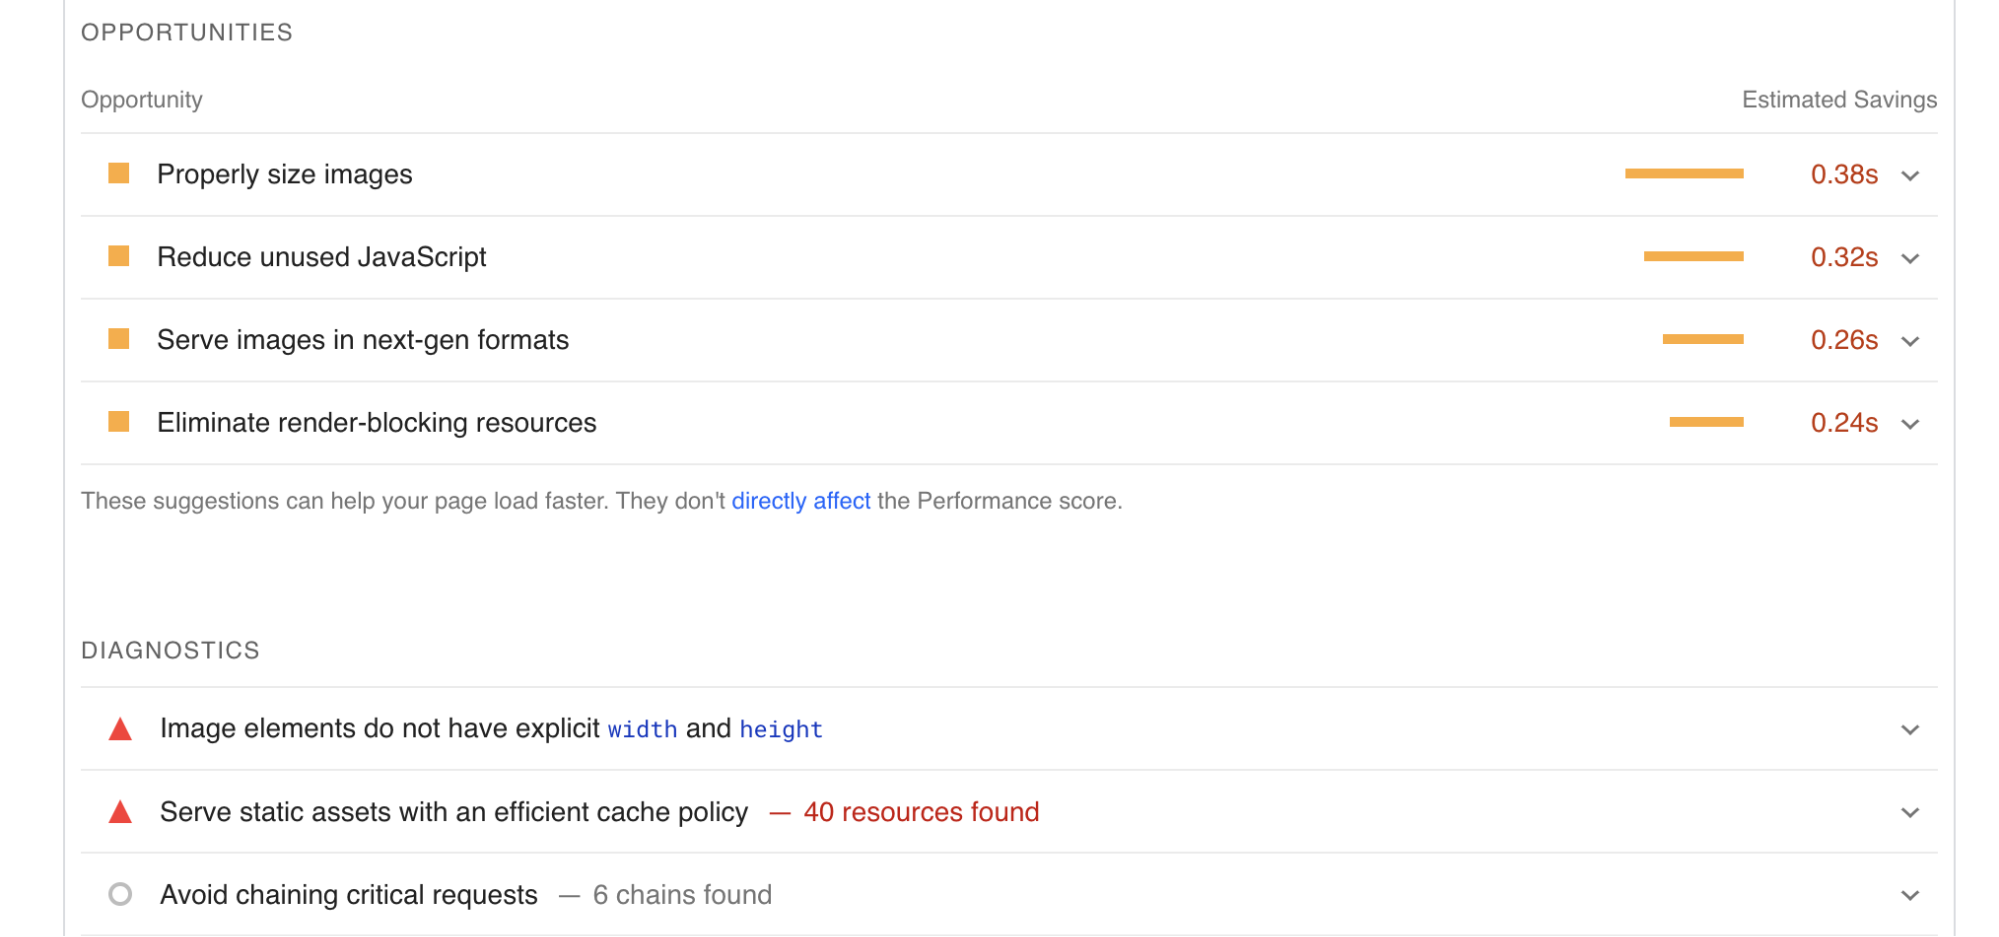
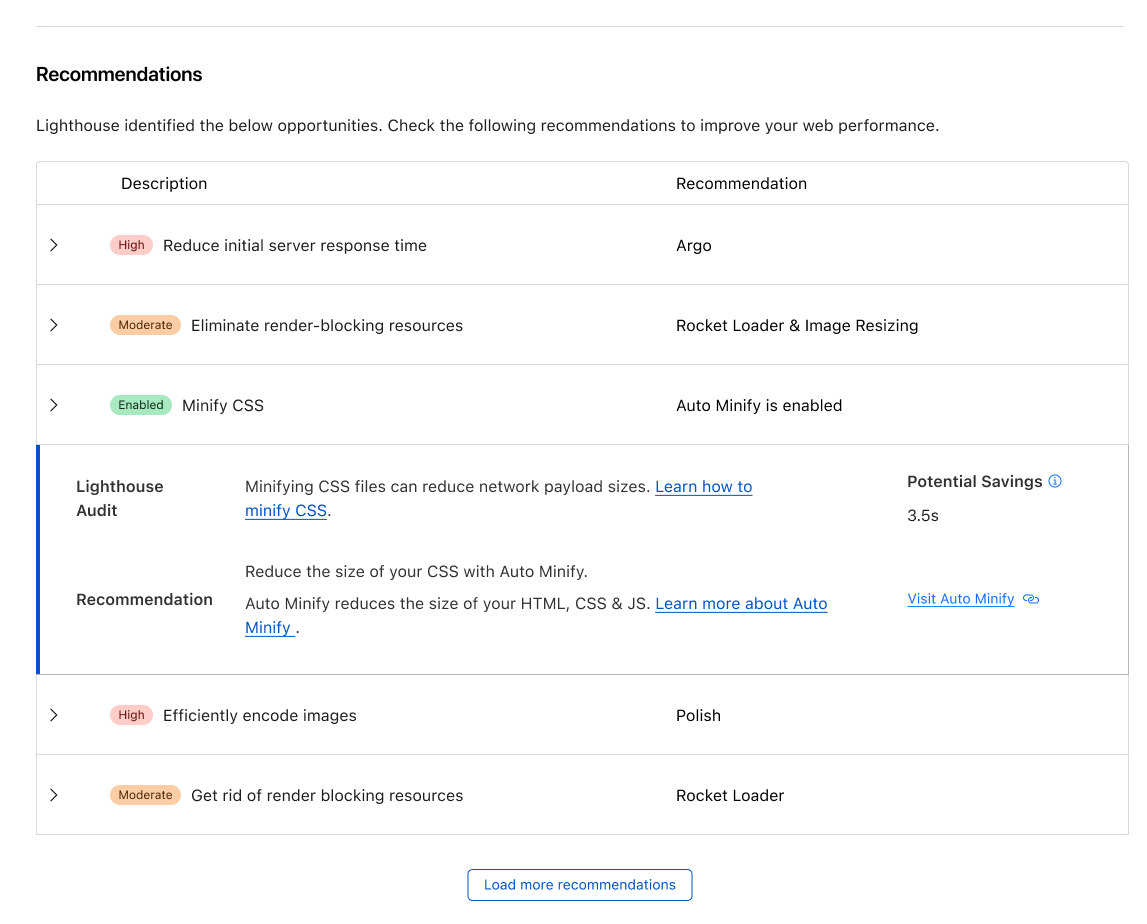
Recommendations from Observatory have become smarter by leveraging the insights gathered from Lighthouse and RUM testing. This enables us to precisely identify issues and offer tailored Cloudflare settings to enhance performance. For instance, when you receive a Lighthouse report it will highlight areas in which your website can be improved. In the provided report, several enhancements for image optimization are suggested. Cloudflare takes this feedback into account and provides product recommendations, such as enabling Polish or utilizing Image Resizing. This empowers our customers to enhance their performance score with just a single click.
Customers will have the convenience of viewing these recommendations within the Cloudflare dashboard, directly linked to the audit. The dashboard will encompass a wide range of Cloudflare features and functionalities, continually improving over time. With the addition of Cache Rules recommendations for uncached static content and a comprehensive testing suite, users will gain valuable insights into the benefits of implementing specific Cloudflare features before enabling them.
By knowing the performance impact of a product or feature before it is enabled, customers can make informed decisions and optimize their website's performance with confidence.
More tests, multiple regions and recurring tests
A significant piece of feedback we received from our old Speed Tab and beta testing was regarding the number and location of tests. We're thrilled to announce that we have addressed this feedback by increasing the number of tests allowed and enabling all plan types to schedule at least one recurring test, originating from a US region.
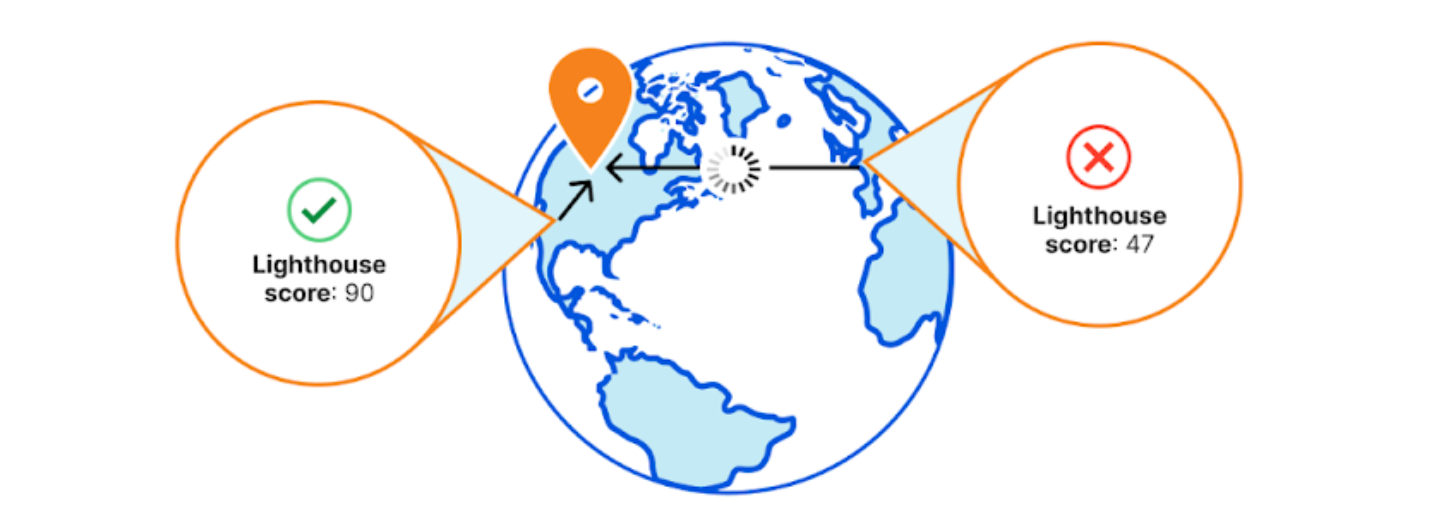
Customers on our Pro, Business, and Enterprise family of subscriptions can run tests from various regions to understand their site's performance in those areas. For instance, if a website is solely hosted in Iowa, USA, and a visitor is accessing it from Sydney, Australia, they will experience a slower page load due to the time it takes for an uncached file to be sent and rendered by the user's browser over a distance of 14,000 kilometers. By running tests from various regions, our customers can gain valuable insights into their website's performance and make informed decisions to optimize it for a better user experience - and an improved page load time.
The higher your plan type the more tests you are able to run and the more regions you are able to use. For example Pro customers can set up five recurring tests for their most important page from five different locations. These test runs will then be stored within the Observatory history tab allowing them to understand their Page Speed score from around the globe. Below is a table detailing the number of tests each plan type can run and the regions available to them.
| Plan | Ad-hoc tests | Recurring tests | Frequency of recurring tests | Regions supported |
|---|---|---|---|---|
| Free | 5 | 1 | Weekly | Iowa, USA |
| Pro | 10 | 5 | Daily | Everything in Free and South Carolina, USA North Virginia, USA Dallas, USA Oregon, USA Hamina, Finland Madrid, Spain St. Ghislain, Belgium Eemshaven, Netherlands Milan, Italy Paris, France Changhua County, Taiwan Tokyo, Japan Osaka, Japan Tel Aviv, Israel London, England Jurong West, Singapore Sydney, Australia Frankfurt, Germany Mumbai, India São Paulo, Brazil |
| Business | 20 | 10 | Daily | |
| Enterprise | 50 | 15 | Daily |
Incorporating RUM
Cloudflare’s RUM service provides insights to a user's browser or devices, tracking metrics such as page load times, response times, and other user interactions. Cloudflare collects RUM data through its Browser Insights feature, which inserts a JavaScript "beacon" into HTML pages. This beacon sends information back to Cloudflare about the performance of a website from the perspective of real users, including metrics such as page load time, time to first byte, and other Web Vitals.
While you can always try a few page loads on your own laptop and see the results, gathering data from real users is the only way to take into account real-life device performance and network conditions.
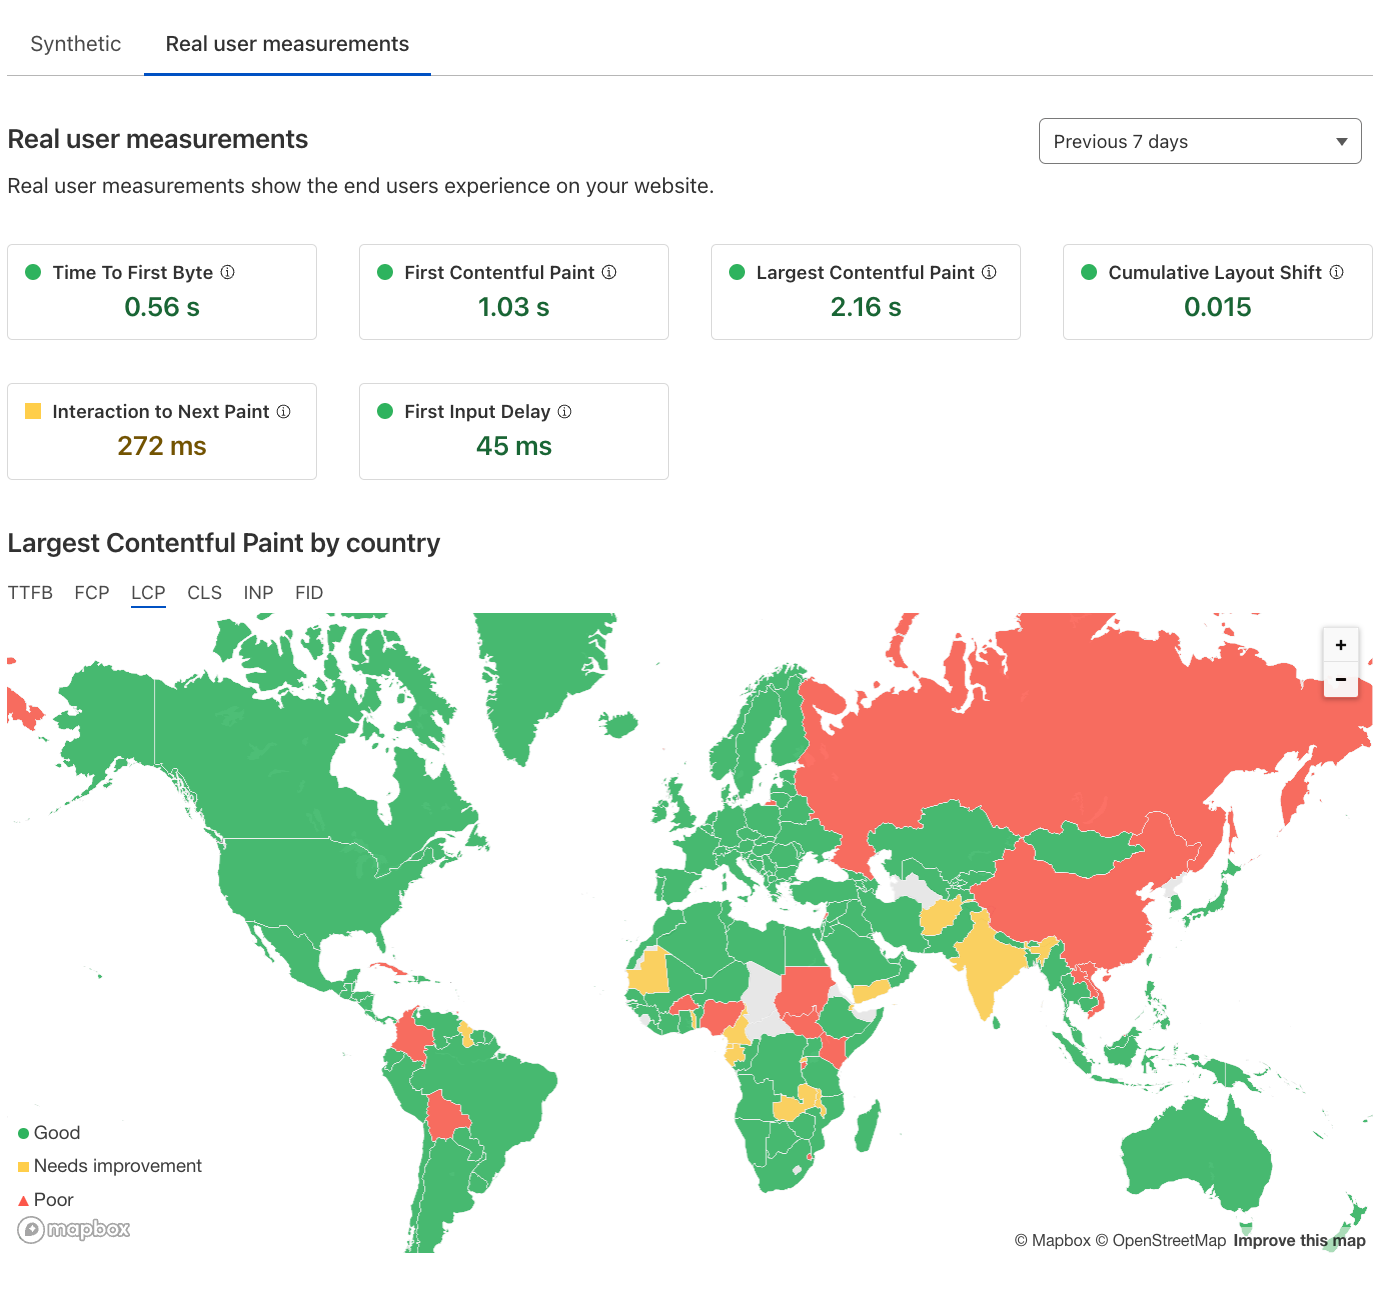
Observatory now incorporates RUM data to match against your tested paths. This allows you to easily see how real users experience your site across the globe. This data is also dissected and located in the Observatory tab against your tested paths. Allowing you to view synthetic test data directly against Real User metrics.
Our RUM provider already incorporates the Interactive Next Paint (INP) Score. In 2022, Google announced Interaction to Next Paint (INP) as that new metric, promoting INP as the new Core Web Vital metric for responsiveness, replacing First Input Delay (FID). FID measures the delay between a user's first interaction with a web page and the browser's response to that interaction. INP measures the delay for any user interaction on a website, not just limited to the first input. This change reflects a more comprehensive approach to evaluating the responsiveness of a website.
If you don't have Web Analytics enabled on your Cloudflare zone then we will be unable to collect and display RUM data within Observatory. Enabling this feature is very simple and instructions can be found here.
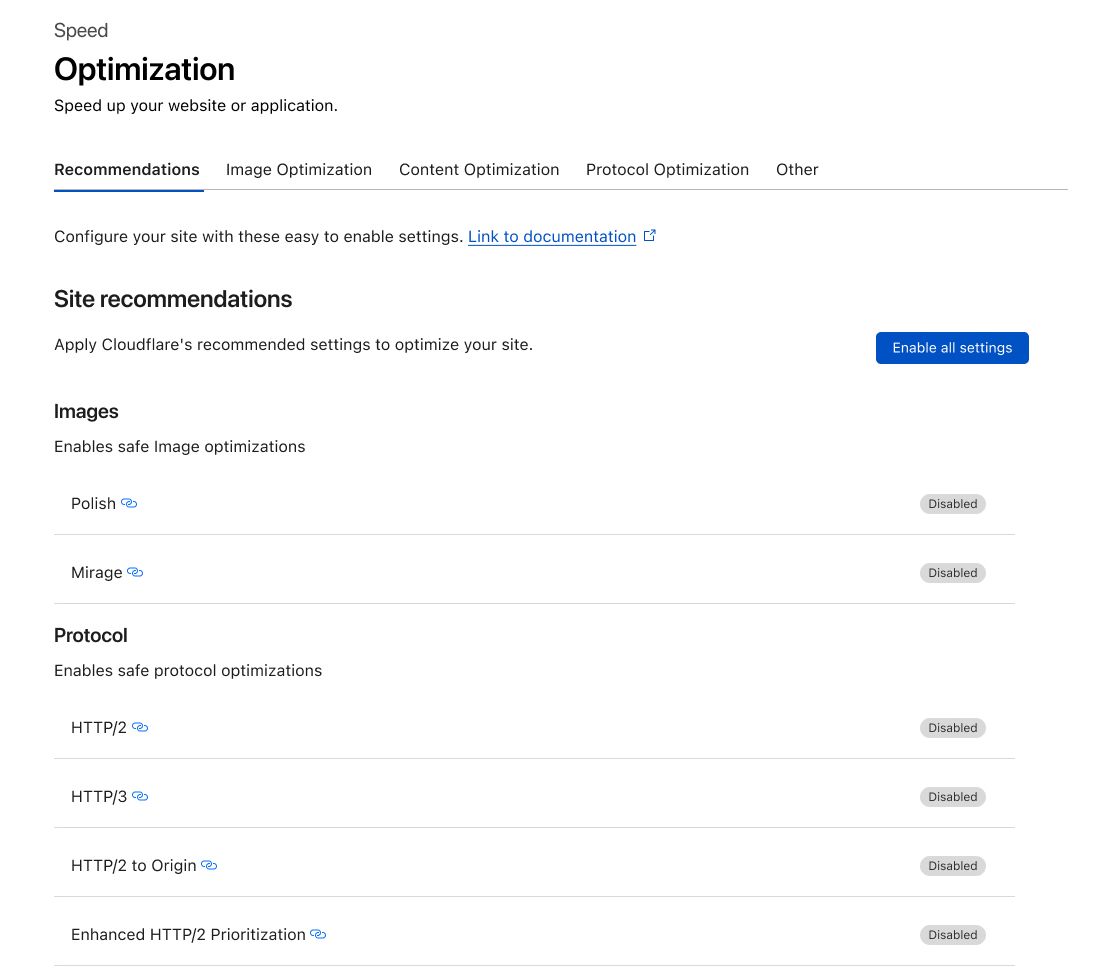
One click optimizations
Observatory now includes an enhanced Optimization layout, which introduces a one-click recommendations center. Enabling these features on your Cloudflare zone enhances optimization for the latest HTTP protocols, including HTTP/3. Additionally, Image Delivery is improved by converting PNGs and JPEGs to the efficient WebP format. Finally, Cloudflare performance tools are also enabled, allowing users to seamlessly implement new technologies such as Early Hints. These features are designed to contribute to improved website speed and overall performance.
As we release new features that we believe are beneficial to our customers, we will continue to add them to the One Click Optimizations. We have also made changes to the overall layout of the tab, splitting our products into subcategories to allow easy navigation to the individual performance products.
Available now
Observatory is available now! Become the Web Performance advocate in your organization by taking advantage of the Observatory features such as Google Lighthouse integration, RUM data, and multi-region testing, all available now. You will be able to gain valuable insights into your website's performance and make informed decisions to optimize and improve your site's performance.
In the coming months, we will continue expanding the Recommendations engine, introducing more products that empower you to continually enhance your website's performance. Additionally, we will provide the capability to simulate requests for specific features, giving you a comprehensive understanding of the real-world performance benefits before implementing them on your website.
We protect entire corporate networks, help customers build Internet-scale applications efficiently, accelerate any website or Internet application, ward off DDoS attacks, keep hackers at bay, and can help you on your journey to Zero Trust.
Visit 1.1.1.1 from any device to get started with our free app that makes your Internet faster and safer.
To learn more about our mission to help build a better Internet, start here. If you're looking for a new career direction, check out our open positions.