2023-8-27 08:0:0 Author: arthurchiao.github.io(查看原文) 阅读量:44 收藏
Published at 2023-08-27 | Last Update 2023-08-27
GPU performance metrics reported by tools like nvidia-smi may be misleading.
This blog delves into the underlying issue to provide a deeper understanding.
- 1 NVIDIA
"GPU util": a confusing phenomenon - 2
GPU Util: a misleading term? - 3 Conclusion and general advice
Even when there is only a single task that is running on a small portion of a GPU,
the "GPU util" metric reported by tools such as
nvidia-smi or other nvml-based tools may indicate that the device is fully occupied,
which is rather confusing for users.
To provide a clearer understanding, consider the example from the NVIDIA developer forum:
__global__ void simple_kernel() {
    while (true) {}
}

int main() {
    simple_kernel<<<1, 1>>>();
    cudaDeviceSynchronize();
}
This code snippet will launch a specified kernel (thread) on a single
Streaming Multiprocessor (SM). Based on conventional understanding, the
“utilization” of the GPU should be calculated as 1 / num_sm * 100%.
For instance:
- If there are 10 SMs on the GPU, the “GPU utilization” should be 10%.
- If there are 20 SMs on the GPU, the “GPU utilization” should be 5%.
However, it has been observed that nvidia-smi may report a "GPU-Util"
of 100%, as demonstrated in the following example output:
$ nvidia-smi
|-------------------------------+----------------------+----------------------+
| GPU  Name        Persistence-M| Bus-Id        Disp.A | Volatile Uncorr. ECC |
| Fan  Temp  Perf  Pwr:Usage/Cap|         Memory-Usage | GPU-Util  Compute M. |
|                               |                      |               MIG M. |
|===============================+======================+======================|
|   0  Tesla V100-SXM2...  Off  | 00000000:1A:00.0 Off |                    0 |
| N/A   42C    P0    67W / 300W |   2602MiB / 32510MiB |    100%      Default |
|                               |                      |                  N/A |
+-------------------------------+----------------------+----------------------+
What’s the problem? Let’s find the answer.
We first do some searches to gain a better understanding.
2.1 Definition from official documentation
The nvidia-smi command line tool is based on the NVIDIA Management Library
(NVML), which unfortunately is not open-sourced. To find some clarifications,
we refer to the official NVML documentation.
According to the documentation,
GPU utilization: Current utilization rates are reported for both the compute resources of the GPU and the memory interface.
This information does not provide the desired clarity. So, move on.
2.2 Exploring the code
Although the NVML library itself is not open-sourced, we discovered that there
are open-source language bindings available for it. This means that we can at
least access the structure and field definitions, typically provided in a C/C++
header file. Here we choose the gonvml project, which
provides a Golang binding for NVML. Here is an excerpt from the NVML header
file that defines the terms "GPU Util" and “Memory Util”:
// https://github.com/NVIDIA/go-nvml/blob/v0.12.0-1/gen/nvml/nvml.h#L210

/**
 * Utilization information for a device.
 * Each sample period may be between 1 second and 1/6 second, depending on the product being queried.
 */
typedef struct nvmlUtilization_st {
    unsigned int gpu;                //!< Percent of time over the past sample period during which one or more kernels was executing on the GPU
    unsigned int memory;             //!< Percent of time over the past sample period during which global (device) memory was being read or written
} nvmlUtilization_t;
With the comments above, we get the answer.
2.3 Explanation
According to the definition provided by NVML, “utilization” refers to the percentage of time that certain activities occurred during the past sample period. Specifically:
- GPU utilization: This represents the percentage of time during which one or more kernels were executing on the GPU.
- Memory utilization: This represents the percentage of time during which global (device) memory was being read from or written to.
In other words, the concept of “utilization” defined by NVML may not align with our common understanding. It solely measures the portion of time that the device is being used within the given sampling period, without considering the number of streaming multiprocessors (SMs) being utilized during that time. Typically, we perceive “utilization” as the portion of GPU processors being used.
I’m not sure why NVIDIA’s defines “utilization” in this unconventional way. But, it may be related to the “utilization” definition within the “USE” (Utilization/Saturation/Error) methodology.
2.4 The “USE” methodology
If you are familiar with the book “Systems Performance: Enterprise and the Cloud”, you may recall the “USE” methodology introduced by Brendan Gregg. This methodology focuses on three key metrics: Utilization, Saturation, and Errors. According to the “USE” blog, the terminology definitions are as follows:
- utilization: the average time that the resource was busy servicing work [2]
- saturation: the degree to which the resource has extra work which it can’t service, often queued
- errors: the count of error events
The “USE” methodology provides an extra explanation for “utilization”:
There is another definition where utilization describes the proportion of a resource that is used, and so 100% utilization means no more work can be accepted, unlike with the "busy" definition above.
In summary, within the “USE” methodology, “utilization” refers to the portion of time a resource is actively serving or working, without considering the allocated capacity. For the latter, the term “saturation” is used. While the “USE” methodology offers valuable insights into resource usage evaluation, redefining a well-established term like “utilization” can lead to confusion. Many people still prefer the concept of “utilization” representing capacity usage or saturation.
If necessary, an alternative term to replace “utilization” could be "used-frequency",
indicating how frequently the device is being utilized.
2.5 Two metric sources: NVML / DCGM
In most cases, the metrics that we are primarily concerned with are related to “saturation”. So, where can we find these GPU metrics?
There are two popular methods for collecting GPU performance metrics:
-
Using command line tools such as
nvidia-smi, which can output data in formats like pretty-print andxml.- This tool is based on NVML (NVIDIA Management Library) internally.
- It collects high-level metrics such as GPU and memory “utilization” (used-frequency), device temperature, power usage, etc.
-
Using services like
dcgm-exporter, which can output data in Prometheus format.- This service is based on DCGM (Data Center GPU Management) internally.
- In addition to high-level metrics, it can also perform profiling and collect detailed saturation data about the GPU devices.
Below are two collections of dashboards that show the metrics collected from nvidia-smi and dcgm-exporter:
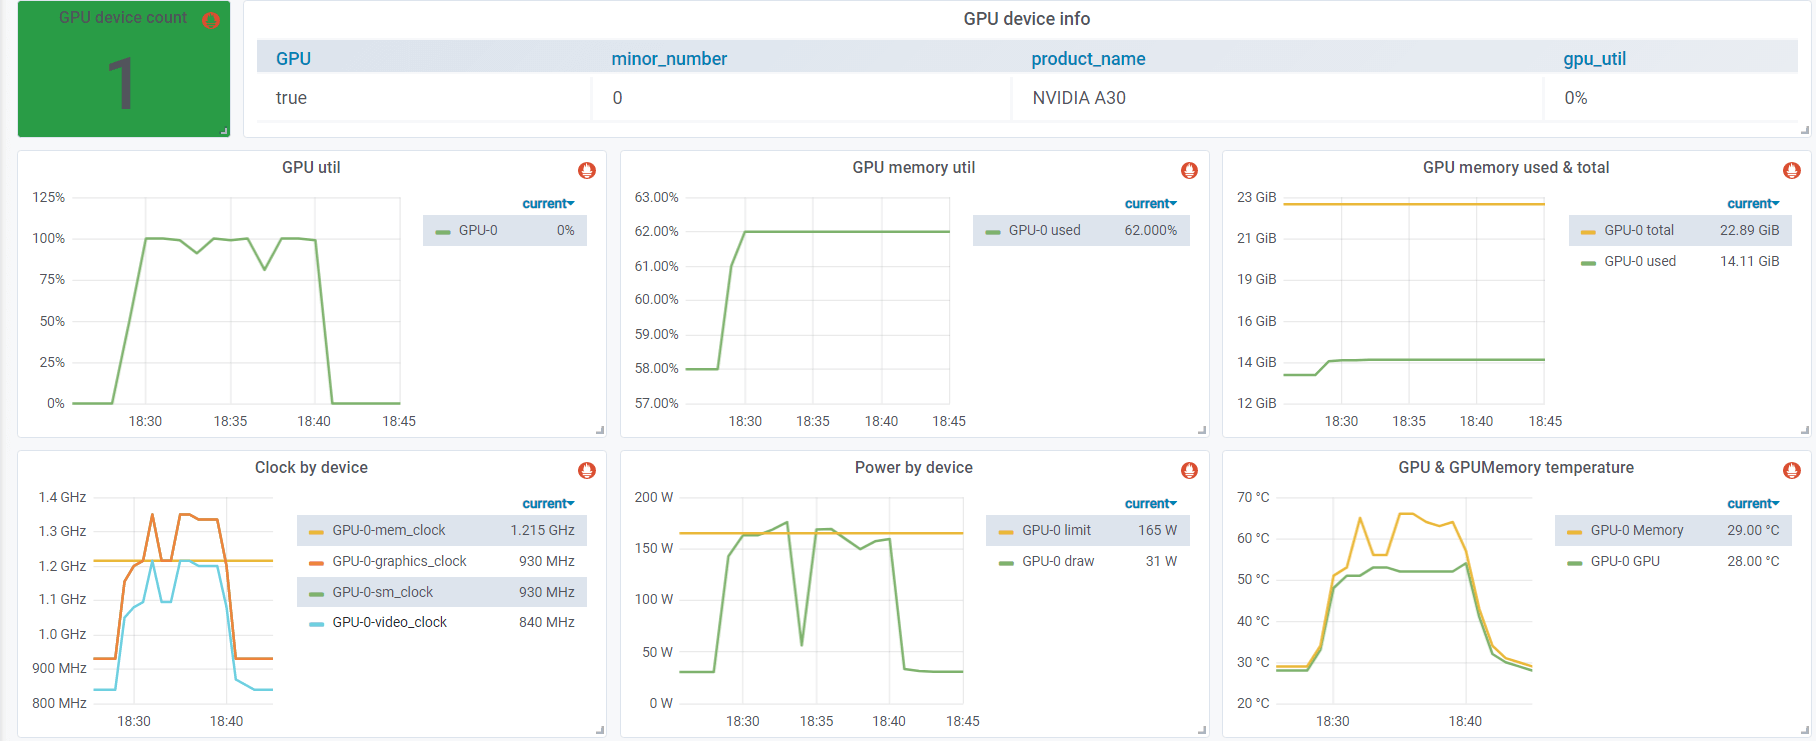
Metrics from nvidia-smi
Note that GPU util is 100%. Below are the metrics collected from dcgm-exporter:
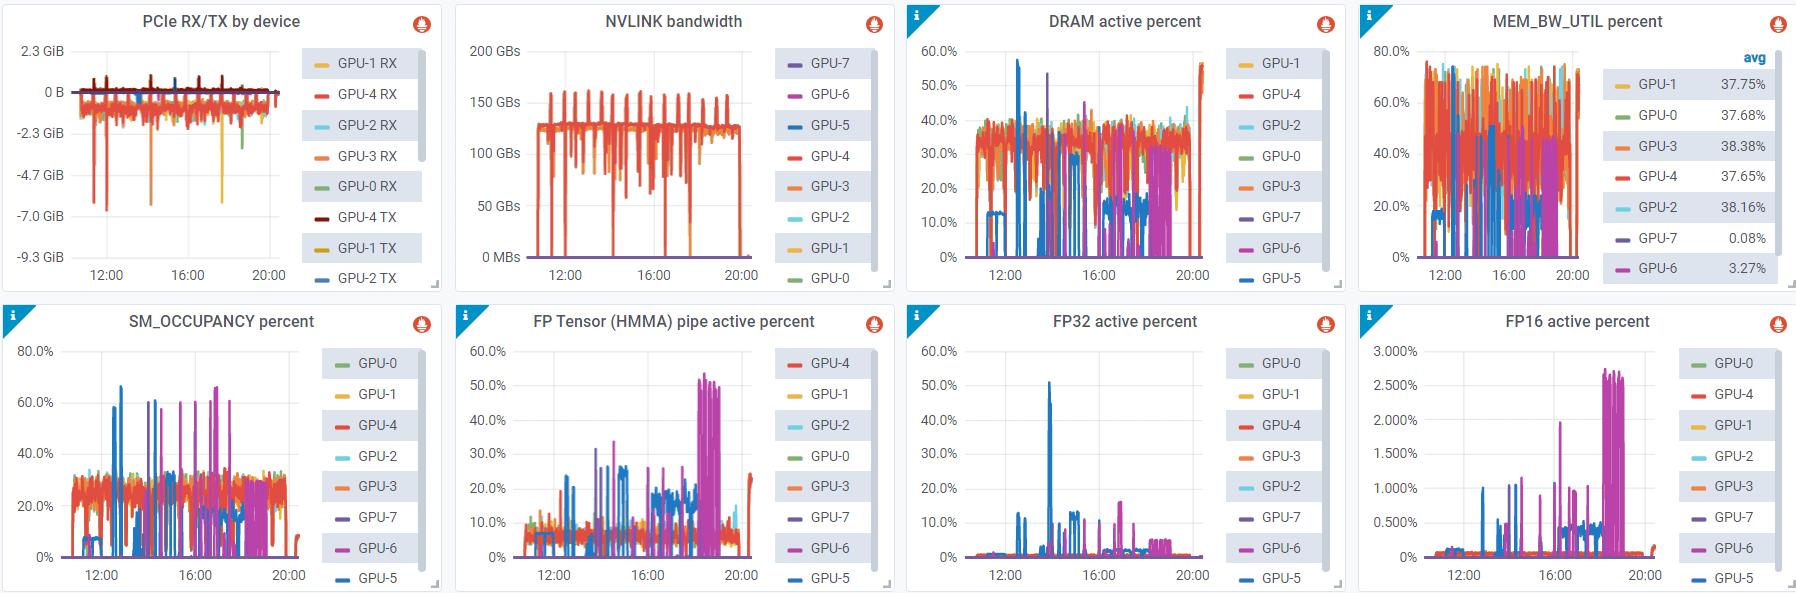
Metrics from dcgm-exporter
We can see that SM occupancy is very low (<20%), and floating point operations (FP32/FP16/TensorCore)
also stays in a very low percent, indicating that the GPU is not saturated.
3.1 “Utilization” vs. saturation
Not sure if the NVML designer intentionally adopted the “USE” methodology mentioned above, but it seems that its definition of “utilization” (including GPU and memory utilization) aligns with the “USE” standard. The reported “utilization” simply indicates the frequency (in percentage of time) at which the device is being used, without considering the amount of capacity being utilized.
3.2 General advice: prioritizing saturation metrics
While nvidia-smi is a commonly used and convenient tool, it is not the
optimal choice for performance measurements. For GPU applications in real
deployment, it is recommended to utilize metrics based on DCGM, such as those
provided by dcgm-exporter.
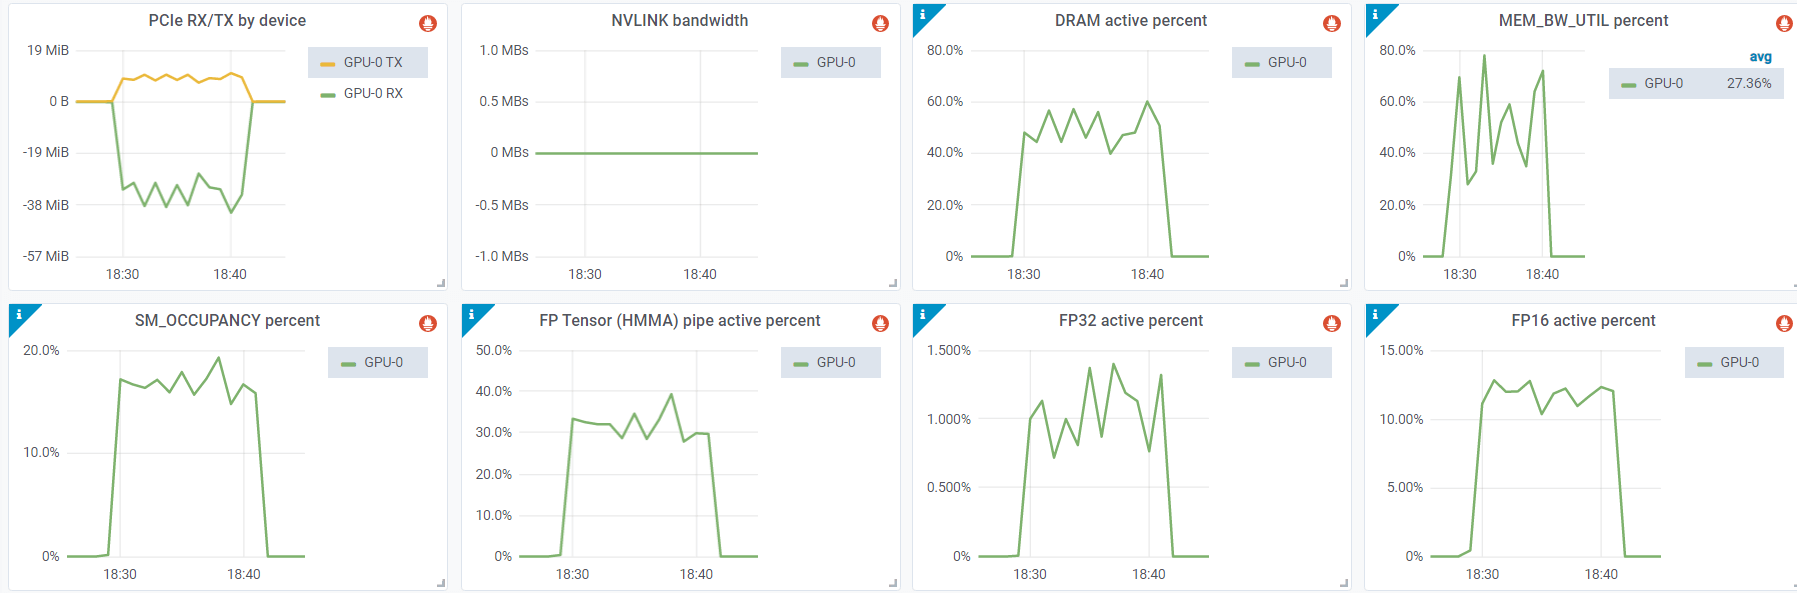
Furthermore, paying closer attention to saturation metrics can be beneficial. These metrics include FP64/FP32/FP16 activation, tensor core activation percentage, NVLINK bandwidth, GPU memory bandwidth percentage, and more.

Metrics from dcgm-exporter
如有侵权请联系:admin#unsafe.sh