

With a slew of decompilation improvements, Binary Ninja 3.5 (Coruscant) has completed its jump from hyperspace dev with even more improvements to the decompilation quality and many other quality of life improvements across the UI, API, documentation, debugger, and more! Here’s a list of the biggest changes, but don’t forget to check out the full list of changes with even more fixes and features.
- MOD/DIV Deoptimization
- Automatic Variable Naming
- UEFI Support
- Heuristic Pointer Analysis
- Dead Code Elimination Improvements
- Type Library Deserialization
- TTD Debugging
- MH_FILESET graduated
- Leaks-Be-Gone
- Experimental Features
- Many More
Major Changes
MOD/DIV Deoptimization
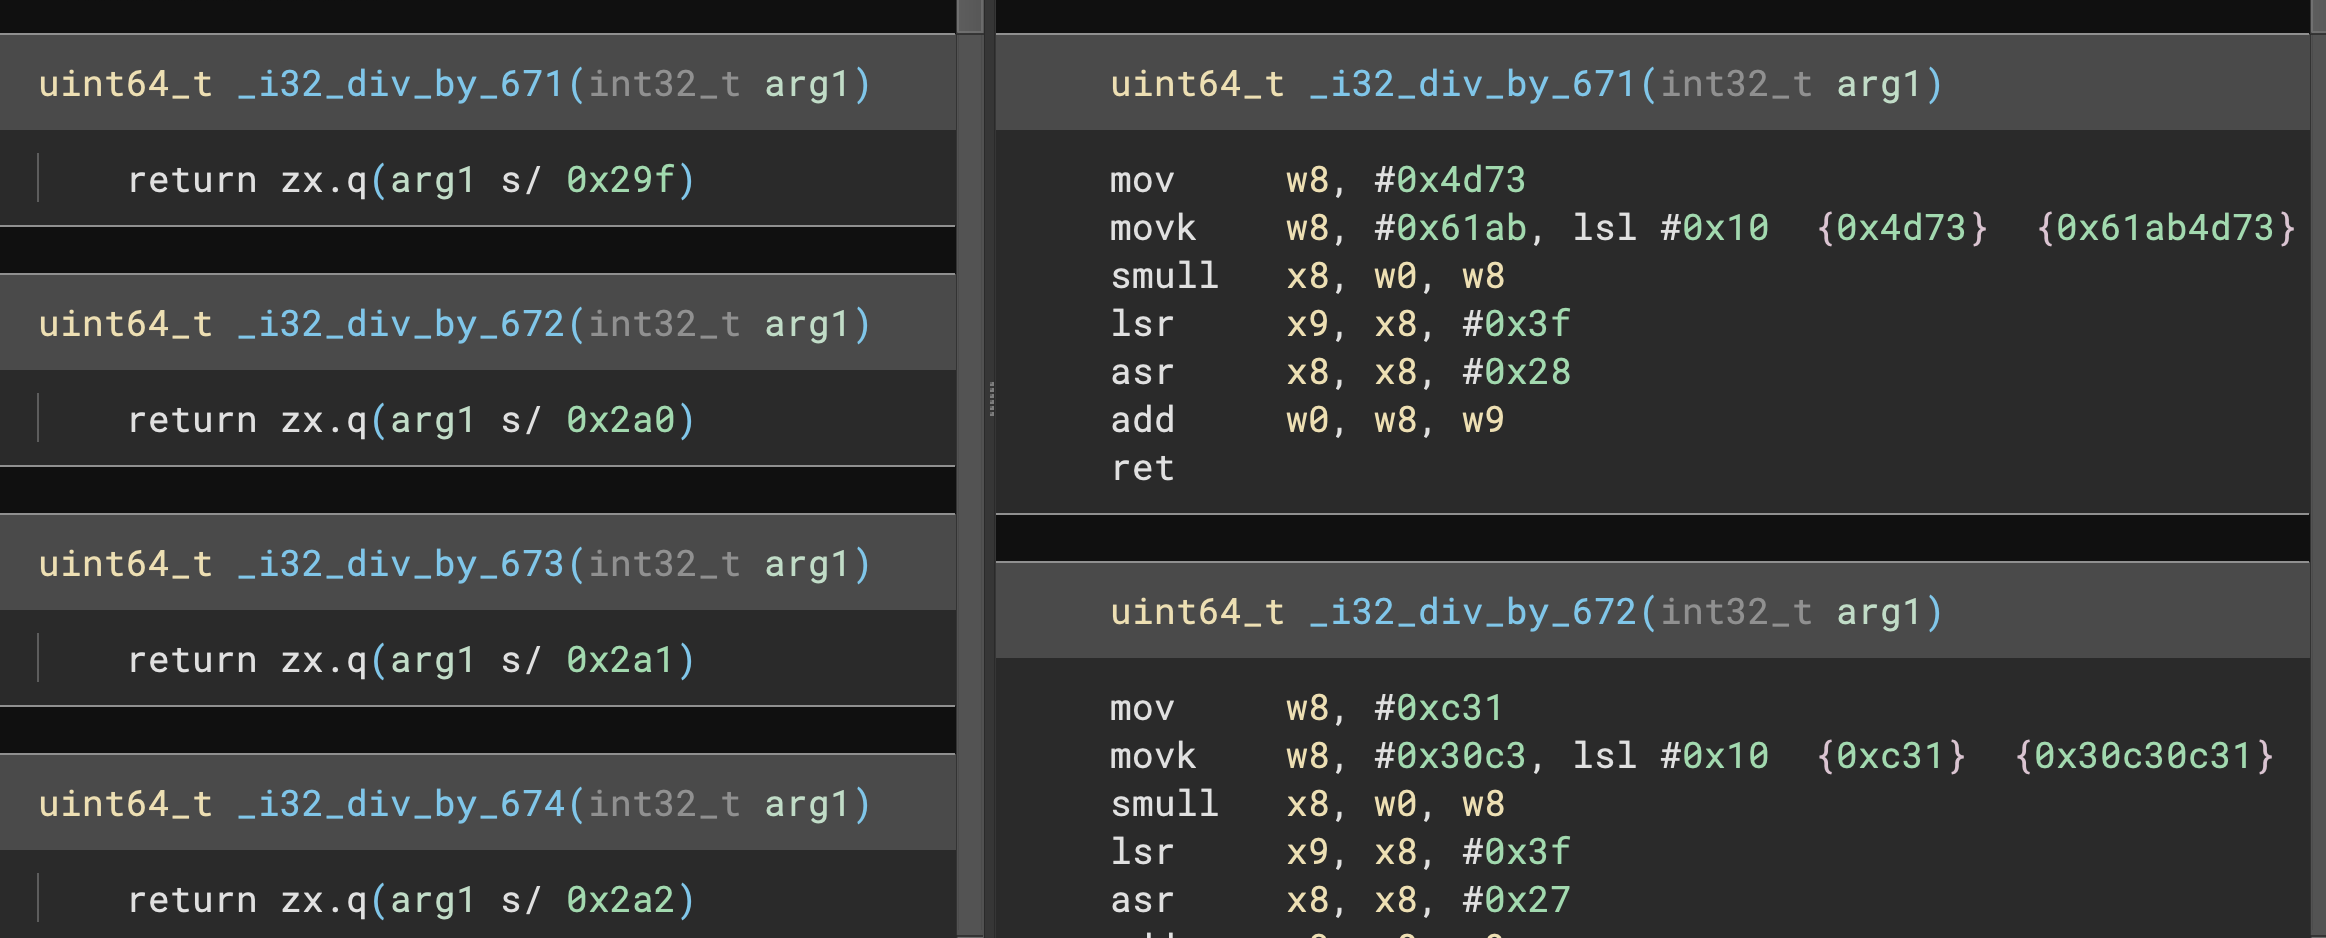
One of the many things compilers do that can make reverse engineering harder is use a variety of algorithmic optimizations, in particular for modulus and division calculations. Instead of implementing them with the native CPU instructions, they will use shifts and multiplications with magic constants that when operating on a fixed integer size has the same effect as a native division instruction.
There are several ways to try to recover the original division which is far more intuitive and easer to reason about. One example as demonstrated by the Division Deoptimization plugin is to use a solver such as z3 to try to recover the simplification. Unfortunately the performance of this implementation at scale and across compilers and architectures is not only slow, but it actually fails at least as often as simpler heuristics.
Finally, there are several heuristics based on detecting particular patterns (asm or IL based) that can be used to identify patterns. This is the route we’ve chosen to go for our division/modulus deoptimization feature. Like most heuristic approaches, this is not a foolproof mechanism! But no other tool is perfectly accurate either. For example, all tested tools fail to consistently reconstruct 16-bit division with small immediate divisors when compiled for x64 using clang:
IDA:
__int64 __fastcall i16_div_by_103(int a1)
{
  return ((unsigned int)(20361 * a1) >> 31) + ((20361 * a1) >> 21);
}
Ghidra:
int _i16_div_by_103(int param_1)

{
  return (param_1 * 0x4f89 >> 0x15) - (param_1 * 0x4f89 >> 0x1f);
}
Binary Ninja:
uint64_t _i16_div_by_103(int32_t arg1)

    int32_t rax = arg1 * 0x4f89
    return zx.q((rax s>> 0x15) + (rax u>> 0x1f))
All existing tools exhibit some gaps in their coverage and there are additional concerns such as how to handle division and modulus calculations on operands that are powers of two. Those can often be expressed as bit shift or mask operations and are indistinguishable from intentional shift/mask operations which are functionally identical.
The wrong implementation can also produce incorrect results. Consider the case of division by 7 for example. At extreme values, an overly simplistic heuristic can incorrectly detect an optimized division that will fail at the extremes due to fractional rounding errors, and conversely can incorrectly detect the actual optimized implementation.
Given the following two similar implementations:
>>> def div_by_seven(input):
...   x8 = (input * 0x2492492492492493) >> 0x40
...   x9 = input - x8
...   x8_1 = x8 + (x9 >> 1)
...   return x8_1 >> 2
>>> def not_div_by_seven(input):
...   return (input * 0x2492492492492493) >> 0x40
...
>>> not_div_by_seven(2**64-10)
0x2492492492492491
>>> div_by_seven(2**64-10)
0x2492492492492490
Ghidra’s Decompilation will be:
ulong _u64_div_7(ulong param_1)
{
  return param_1 / 7 + (param_1 - param_1 / 7 >> 1) >> 2;
}

ulong _u64_not_really_div_7(ulong param_1)
{
  return param_1 / 7;
}
Binary Ninja’s decompilation:
uint64_t _u64_div_7(int64_t arg1) __pure
{
    return (arg1 / 7);
}

uint64_t _u64_not_really_div_7(int64_t arg1) __pure
{
    return ((int64_t)((arg1 * 0x2492492492492493) >> 0x40));
}
That said, Binary Ninja’s implementation is by no means complete. In particular, armv7 support is currently lacking due to a lifting issue (which we will resolve shortly after the stable release on dev), while the armv8, x86, and x64 across all possible integer sizes and compilers average about 55% across all possible exhaustive deoptimizations. If you’re curious, we tested a matrix of all integer sizes from 8, 16, 32, and 64 both signed and unsigned for both div and mod on all four of the above architectures using clang, gcc, and msvc.
If you’re working on armv7 and this feature is important, consider switching to our development release channel and you should get the deoptimization improvements shortly after the stable release!
Automatic Variable Naming
One easy way to improve decompilation output is to come up with better default names for variables. There’s a lot of possible defaults you could choose and a number of different strategies are seen throughout different reverse engineering tools. Prior to 3.5, Binary Ninja left variables named based on their origin. Stack variables were var_OFFSET, register-based variables were reg_COUNTER, and global data variables were (data_). While this scheme isn’t changing, we’re being much more intelligent about situations where additional information is available.
For example, if a variable is passed to a function and a variable name is available, we can now make a much better guess for the variable name. This is most obvious in binaries with type libraries. Here’s a sample EXE file showing this new default naming:
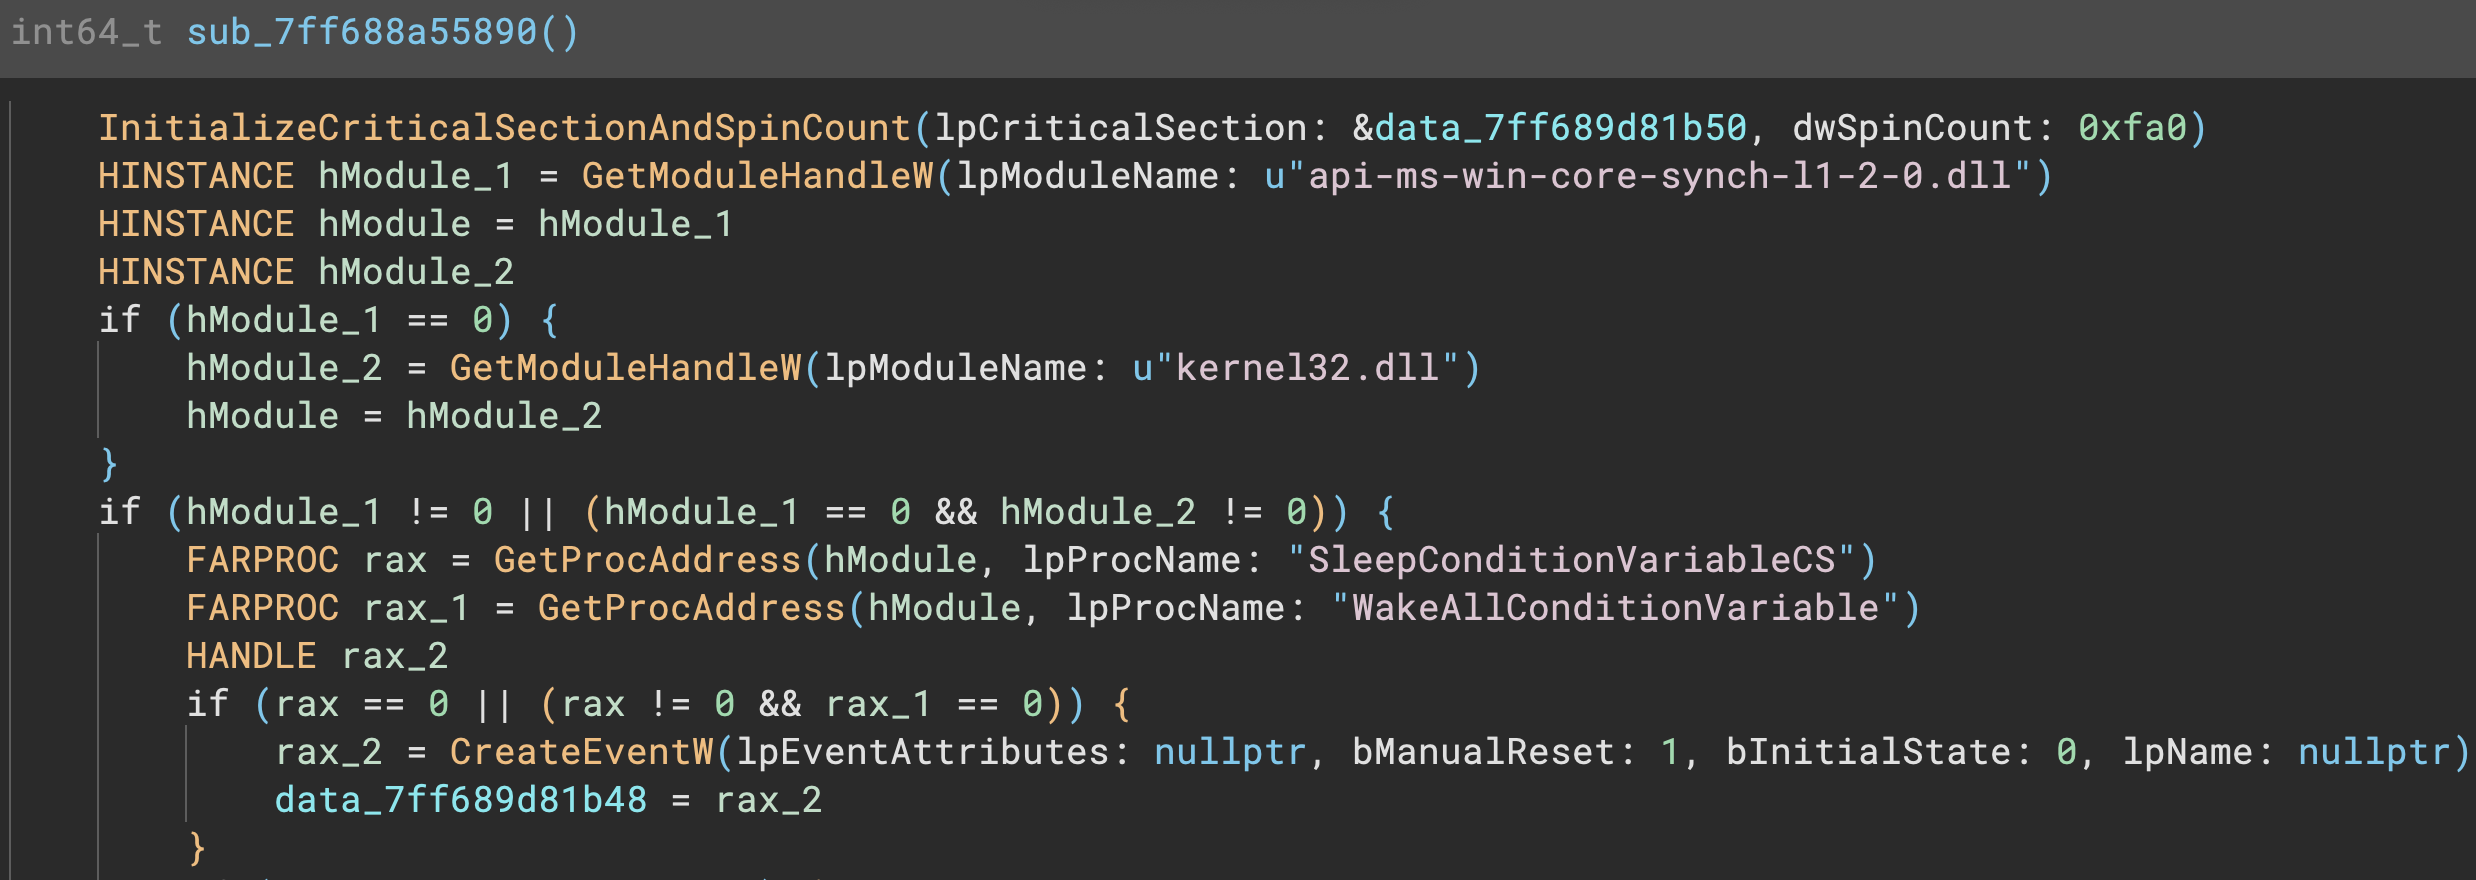
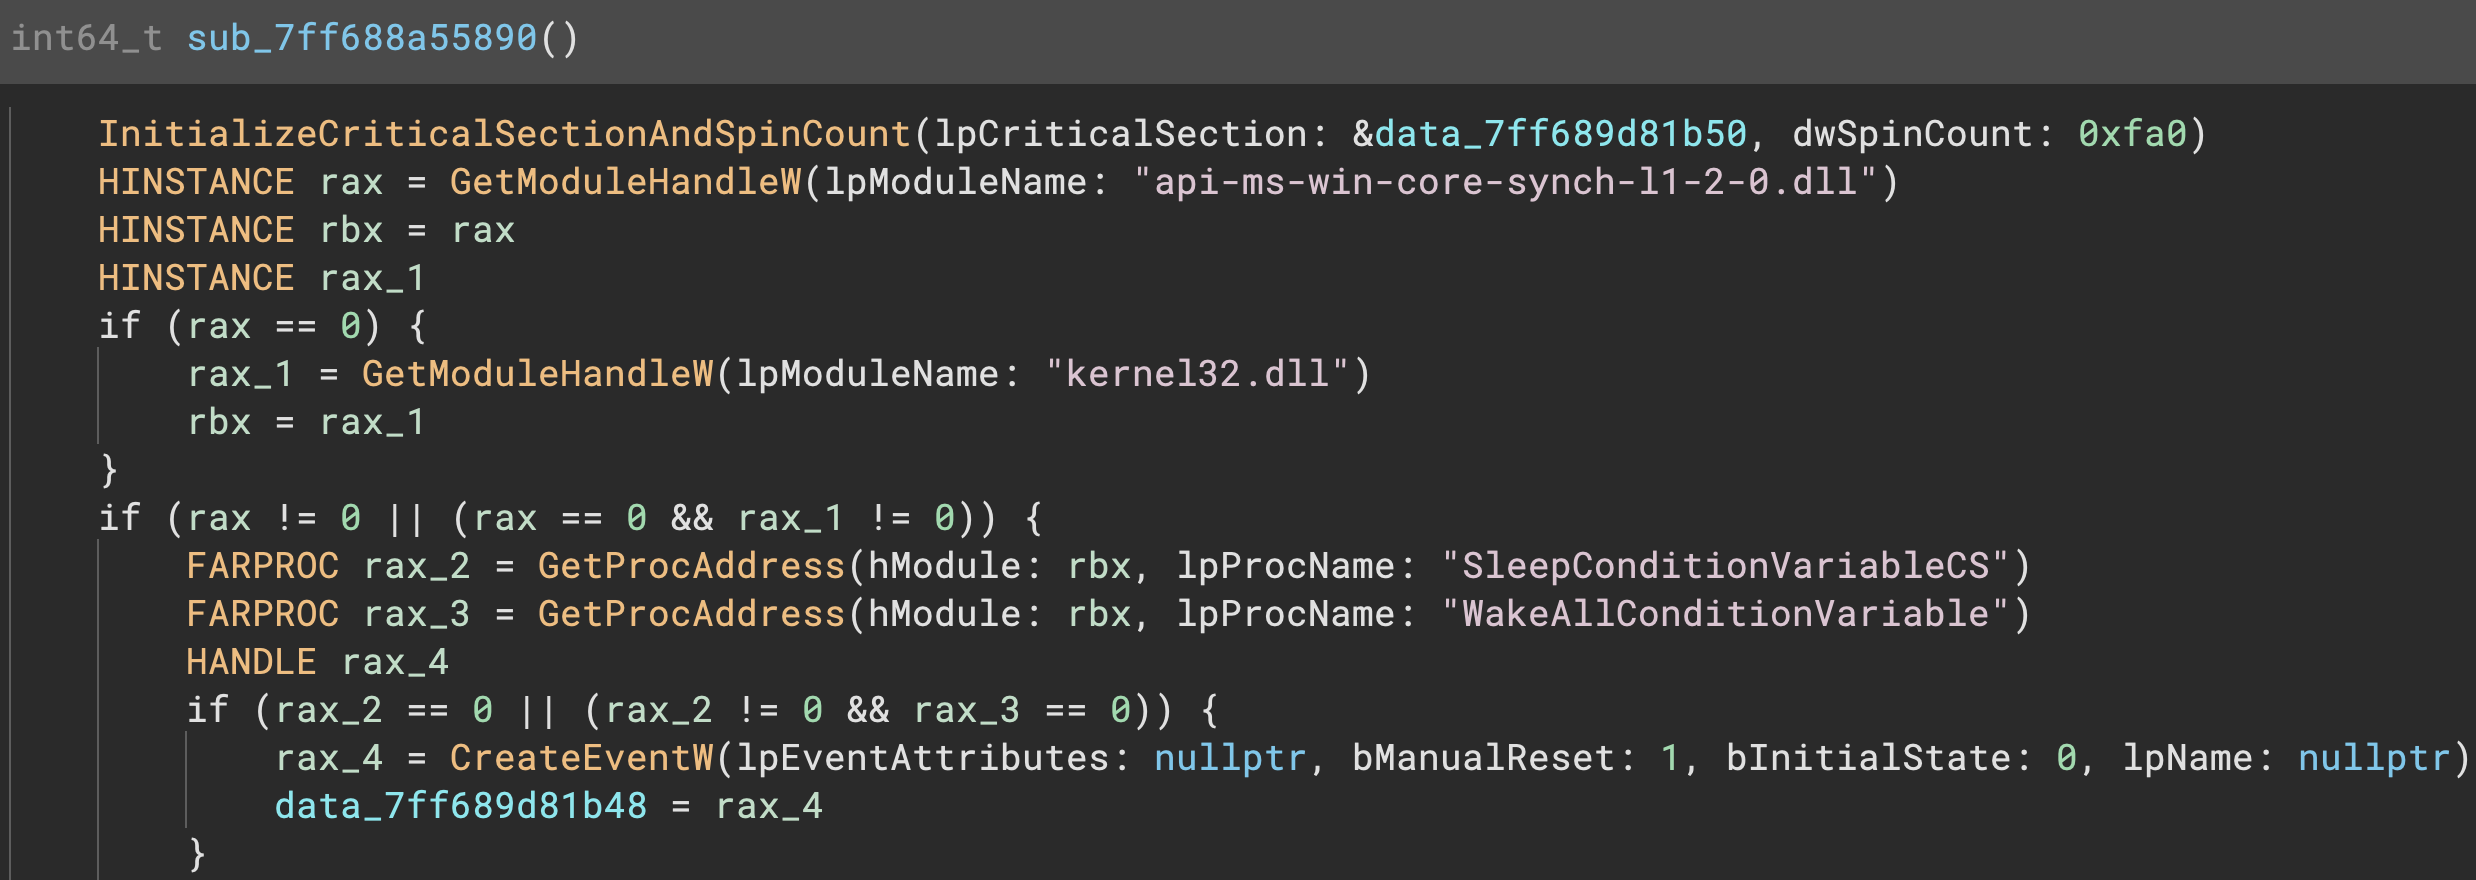
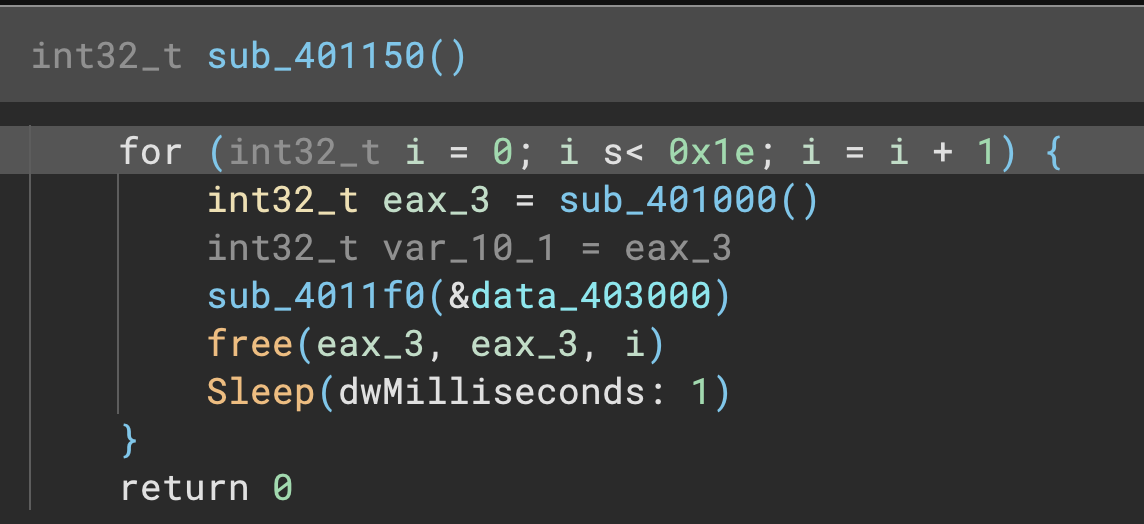
This isn’t the only style of default names. Binary Ninja also will name loop counters with simpler names like i, or j, k, etc (in the case of nested loops):
UEFI Support
3.5 contains brand new UEFI support. Not only has a new EFI platform been added with support for some built-in platform types and automatic recognition of UEFI firmware files, but we’ve also released an official EFI Resolver plugin that resolves many GUID Protocols to add additional symbols and type information.
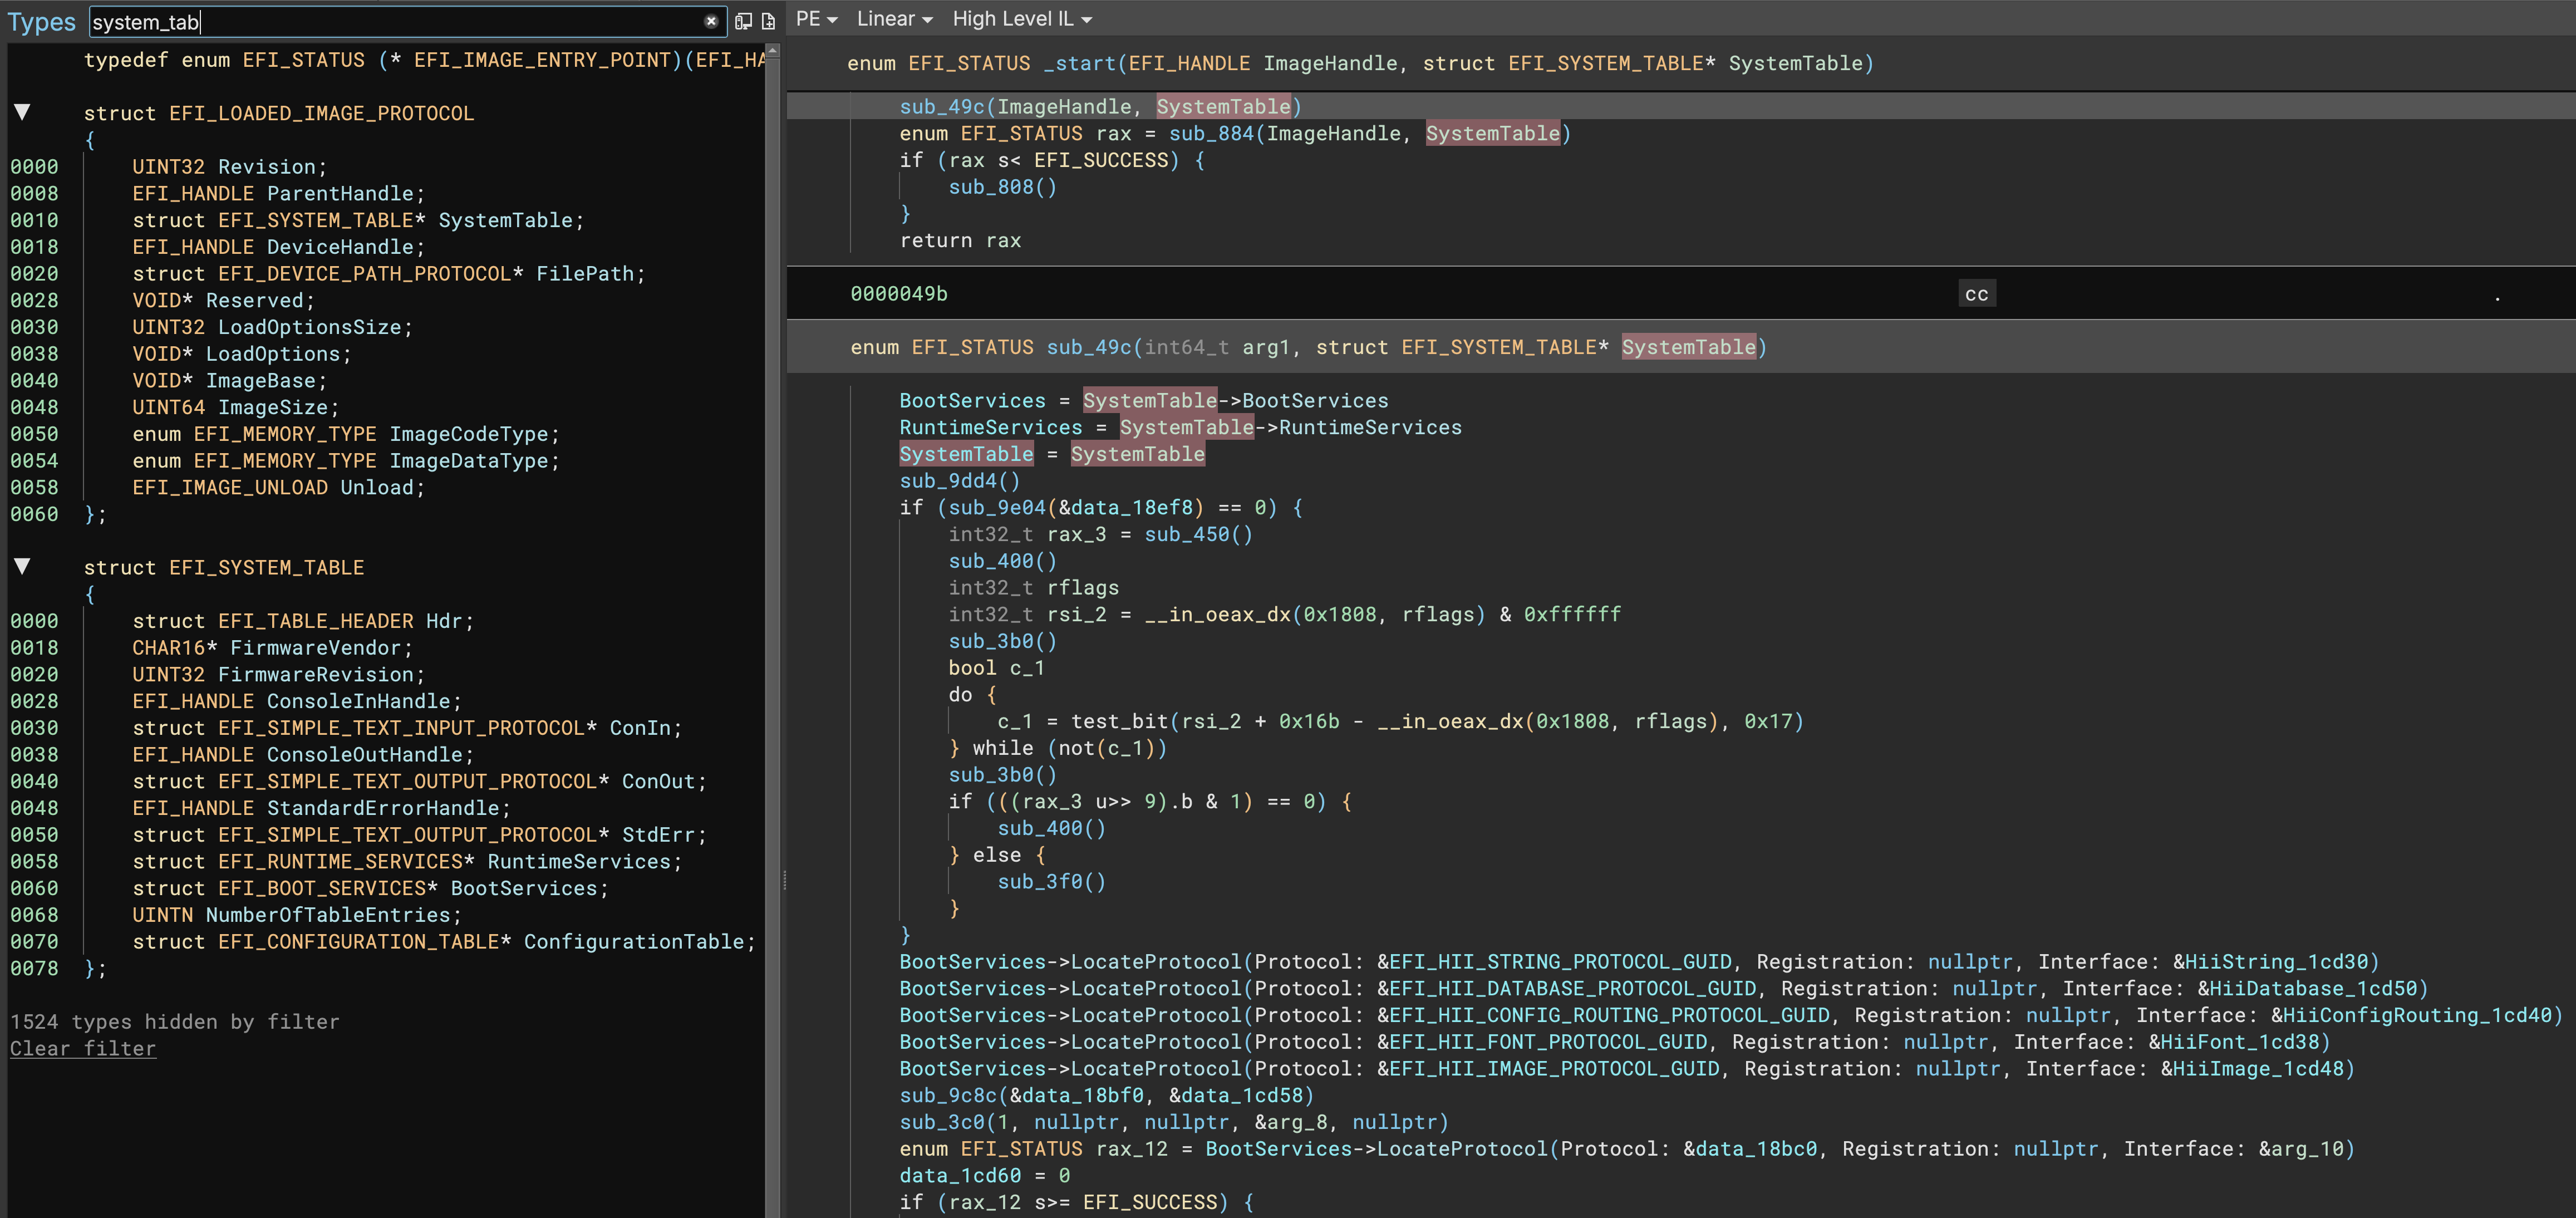
As we often do for supplemental analysis in plugins, we’ve released the EFI Resolver plugin under a permissive license and PRs or issues are welcome!
Heuristic Pointer Analysis
Another straightforward but valuable improvement to analysis has come in the form of Heuristic Pointer Analysis. Prior to 3.5, pointers were created any time a use of a pointer was observed in code, but there are a number of situations (such as virtual function pointers) where a heuristic that identifies and creates pointers can improve future analysis (such as RTTI recovery).
The current implementation is enabled by default behind the analysis.pointerSweep.autorun setting, and can also be manually triggered via the Analysis / Run Pointer Sweep menu, or the Run Pointer Sweep action in the command palette.
Conditions for detecting pointers include:
- must not be in a partial relocation (i.e., a relocation only covers part of the pointer value)
- does not point to the start of the binary (avoids a significant number of false positives)
- if a relocation exists, always create a pointer with high confidence
- if the value points to a function or data variable, create a pointer (incidentally, because the analysis can trigger multiple updates, pointers to things that are NOT functions or data variables are put on a list to be analyzed later in case a function or data variable shows up after further analysis)
Dead Code Elimination Improvements
The issue associated with this improvement is titled “improved stack structure aliasing”, however the end impact for most users will be more accurate dead code elimination. Why is that? First, let’s talk about stack variable aliasing. Aliasing occurs any time memory can potentially be accessed through different addressing mechanisms. Because a struct base pointer can be used to access the members at fixed offsets, stack structures are often modified in ways that are hard for program analysis to track without careful alias analysis. Thus it is often better to make conservative assumptions about potentially aliased stack locations, even at the expense of missing decompilation optimization opportunities.
Prior to 3.5, Binary Ninja was fairly aggressive with assuming constant values on the stack. If it saw only a single reference writing a value, and no other writes, it would assume that constant value during later analysis. However, if the value was part of a structure and was changed by a different reference (in this case, the base pointer plus an offset), this would mean that the decompiler’s assumptions about the value being constant were incorrect.
This issue combined with dead code elimination (where constant values cause conditionals to be removed when the value is known) meant that Binary Ninja was removing live pieces of code that shouldn’t be removed. The newly improved analysis better accounts for variable aliasing, allowing Binary Ninja to be less inappropriately aggressive about assuming values are constant.
Of course, the downside to this change is that there are times where you DO want the values to be treated as constant for dataflow/analysis purposes. Thankfully, this is easy to do. You can either mark the variable as const or use UIDF to set the value so that constant data flow propagation can continue, potentially enabling other decompilation optimizations.
Type Library Deserialization
Prior to #3903 being resolved, the first time you loaded a binary in Binary Ninja, you could experience up to a few seconds of delay as all type libraries were de-serialized even if they weren’t relevant for the file type you were opening. However, as of this release, that is no longer the case. Now, type-libraries are de-serialized on demand resulting in much faster load times!
Users most likely to be impacted by this performance improvement will be those batch-processing files where they are also using one binary per executable (which is actually recommended behavior for other reasons) though of course all users will see a very small improvement in initial load times.
This was additionally noticeable in situations like dogbolt.org where the slower de-serialization was disproportionally slowing down our decompilation compared to other tools. By the time you’re reading this blog, the new version should be live (there’s actually a sneak “refresh” icon that’s disabled by default that you can use the web developer console to enable to reload decompilation with the latest version if you’re looking at results from an older version of one of the tools)
TTD Debugging
TTD (Time-Travel Debugging) is a technology that records an execution trace of a program or system and then replays it during debugging. We have integrated WinDbg’s TTD capacity into our debugger, which allows you to replay traces recorded by WinDbg, within our debugger user interface. Of course, this capability is only possible when debugging Windows binaries at this time though future support for other backends capable of TTD is under consideration.
TTD brings unparalleled advantages over traditional debugging. It can save you a lot of time since you no longer need to restart the target repeatedly. It also makes it easier to stop the target at certain point. Say if a loop is executed 100 times, and you want to break the target at the last iteration. This is not very easy to do in traditional debugging, but it is trivial in TTD: just place a breakpoint right after the exit of the loop, and reverse execute a few instructions. TTD is also helpful for malware analysts since, for example, the C&C server could reject the requests if someone tries to download the payload multiple times.
To get started, follow the setup instructions and explore the potential of TTD!

MH_FILESET Graduated
You might remember that MH_FILESET support was in the experimental section of the 3.4 release, and we’re pleased to announced it has graduated and it is enabled by default! Any time you open a new MachO file containing MH_FILESET records you won’t have to do anything to take advantage of this new feature.
Experimental Features
Experimental features are those that are shipped in the product but either disabled by default, or have known limitations that prevent us from advertising them as fully ready. We encourage testing and please let us know if you find any issues with this features either via GitHub, or slack, or more.
Components UI
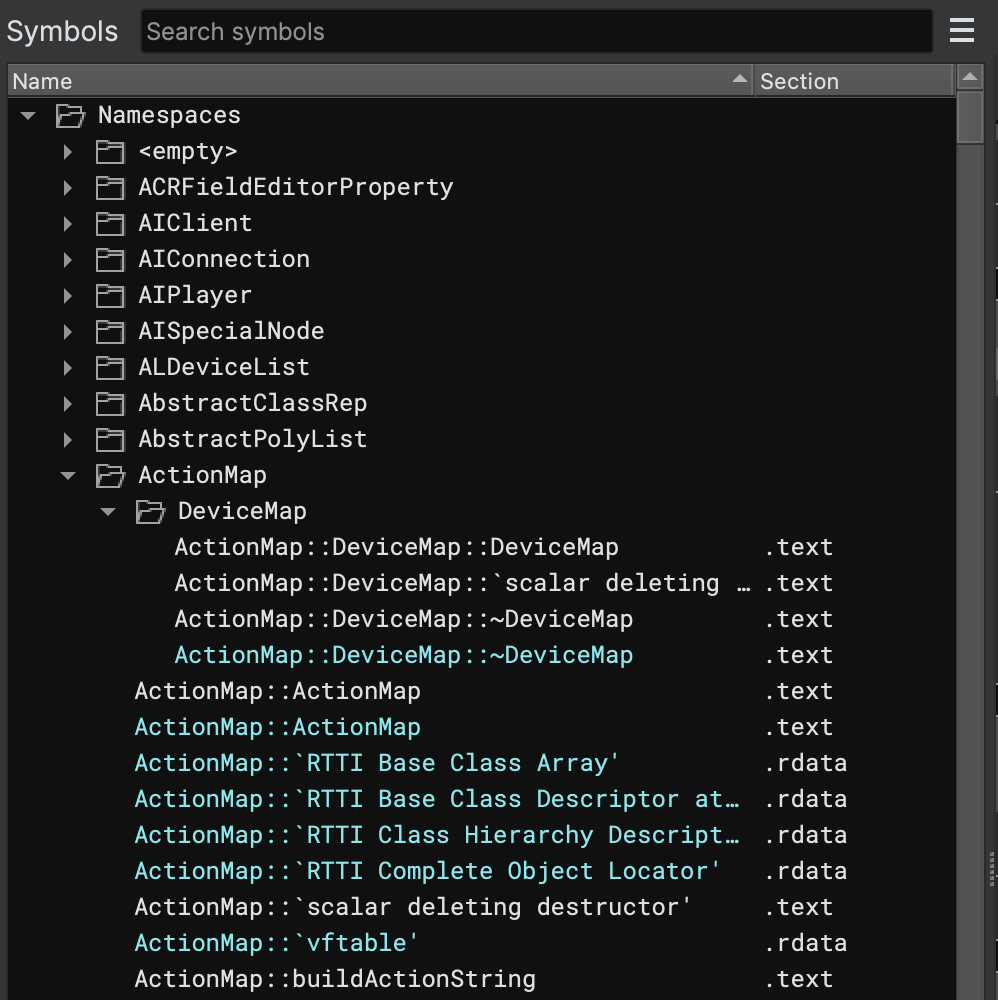
Despite some improvements and fixes to the components UI, we’re still leaving it in the experimental category for one more stable release. We expect that soon after the 3.5 release however we will be enabling it by default for the upcoming 4.0 release.
DWARF Import
Our previous official DWARF Import plugin has been deprecated in favor of a new built-in plugin. However, it is currently still experimental and is disabled by default. Additional testing is welcome, simply go to settings and search for “dwarf” to enable the Import Plugin:

Once enabled, ELF and MachO files with embedded DWARF will automatically be parsed when the file is loaded.
DWARF Export
While enabled by default, the DWARF export plugin is still considered experimental. However, since it is triggered manually via the “Export as DWARF” action, or the Plugins / Export as DWARF menu item, the plugin is enabled by default.

Exporting as DWARF allows you to create an external file with data such as symbols and types that could be associated with the primary executable in another tool that can’t parse Binary Ninja’s database format. Currently exported features include:
- Function starts
- Function names, type information (including parameter name and type information)
- Data variable name/types
- All other type information
Leaks-Be-Gone
During our standard release process testing we identified a memory leak introduced during the last development cycle. As we tested that fix we realized there were a number of other latent leaks that had evaded previous testing and we spent significant time hunting and eliminating them these past few weeks. Many use cases won’t be effected if you tended to reverse engineer one binary at a time and restart between sessions. However, if you were previously opening/closing many binaries in the same session it’s possible you’ll see significant memory reduction as a result of these improvements! Several examples of previous leaks include leftover BinaryView references being retained as a result of certain rebasing operations, certain debugger operations, and others.
Other Updates
Special thanks to (in no particular order): jprokos26, mmaekr, tanakalian, meithecatte, JJTech0130, toolCHAINZ, emesare, alexrp, unknowntrojan, mkrasnitski, amtal, SmoothHacker, yrp604 and ek0 for your contributions to our open source components during this release cycle!
UI Updates
- Feature: Enter/Exit Block UI Indicators
One common problem with scrolling through large flow graphs is that, when scrolling out to see the structure of the graph, it becomes difficult to see the control flow. While looking at the nodes from this perspective is helpful for mentally organizing the graph into chunks, early returns can introduce invisible control flow since you cannot easily see which blocks have outgoing arrows. Now, entry and exit nodes will be marked with an indicator visible from any zoom level, showing where control flow happens, both in to and out of the function. As well, blocks that cannot return, such as calls to abort(), have a distinct color from normal returns. These indicators should help with scanning larger control flow graphs while doing analysis, and hopefully improve your speed and accuracy when gaining first-pass overview knowledge of a function.

- Feature: Rainbow Braces
A common feature in many text editors, rainbow braces are now supported in Binary Ninja as well. This should help with scanning for matching sets of parentheses in lines with complex conditions, as well as marking indentation levels for deeper-nested blocks.
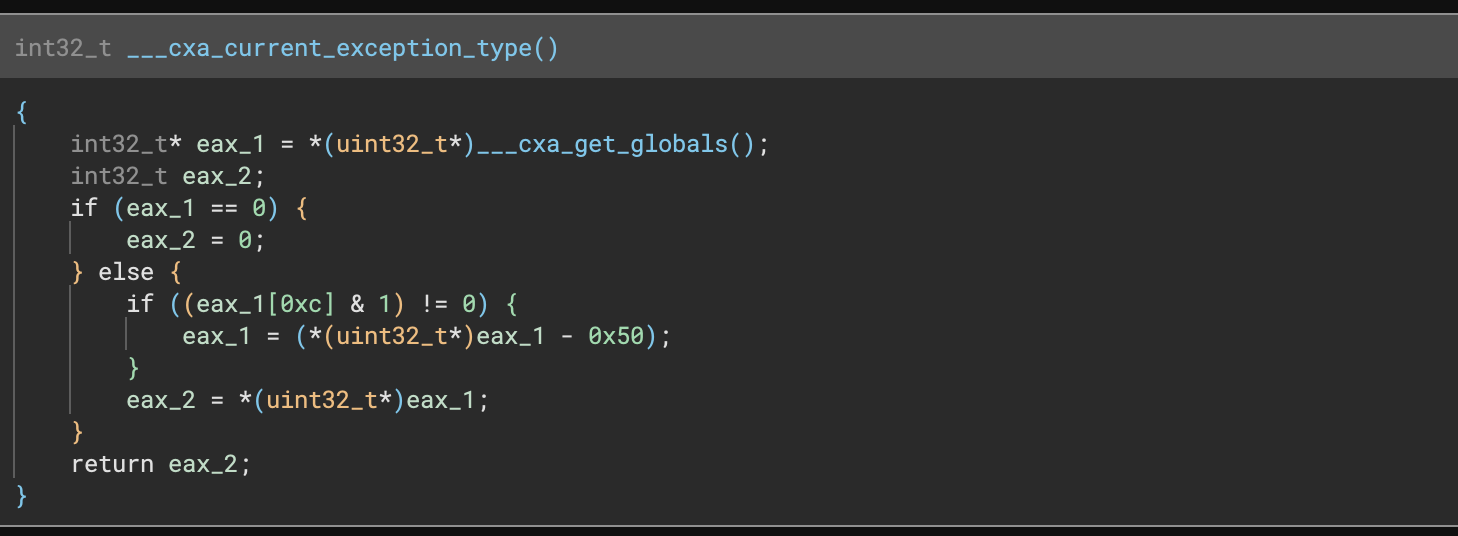
- Feature: Highlighting a brace highlights its matching brace
Along with rainbow braces, now you can highlight a brace (or bracket/parenthesis) and see its matching closing brace. This should improve your ability to analyze complex expressions by showing you the grouping of operations and instructions.

- Feature: New setting (
ui.view.common.commentWidth) for line-wrapping comments - Feature: Double clicking an enumeration now takes you to the type in the type sidebar
- Feature:
Nhotkey can be used to name an enumeration member at a use - Feature: Selecting an array token will show cross-references to all members, not just the first one whereas selecting the index will show specific cross-references
- Feature: Can now copy the contents of tags from the tag list with the usual hotkeys or menu items
- Feature: A new
Restart with Plugins Disabledaction created for easier troubleshooting - Improvement: “Copy” and “Copy-As” now copy full source strings, not just truncated ones rendered in the UI
- Improvement: Log type dropdown in the Log window remembers previous selection
- Improvement: Create Type dialog doesn’t require a semicolon at the end of all lines anymore
- Improvement: Updated plugins now remember their enabled/disabled state
- Improvement: All filter boxes now have a 500ms delay before filter to improve performance when a large number of items exist
- Improvement:
Add Segmentdialog has proper buttons and is no longer resizable - Improvement: Created tags refresh the UI
- Improvement: Narrow gutter handles multiple tags
- Improvement: Hovering a data variable that was a function pointer now shows the destination as code, not data
- Improvement: Create Array dialog allows hex item counts now in addition to decimal
- Improvement: Better rendering of enum logic in HLIL
- Improvement: Can override call type on HLIL calls that are not top-level instructions
- Improvement: Data variables pointing inside of structures show as field/offset with the address as an annotation
- Improvement: Hover over a stack local variable now shows the offset in hex, not decimal
- Improvement: Selecting a quoted string will select the contents, not the quotes, and if the string is truncated, the full value can still be copied
- Improvement: Wide strings are visually distinct in the UI with a prefix (“U” for 32bit “u” for 16bit)
- Improvement: The Log category persists across tabs and restarts
- Improvement: Duplicate Variable Name dialog text is more understandable
- Improvement: The default name for a database now includes the original file extension
- Improvement: Enter in the comment dialog box now submits the box making single-line comments far faster (shift-enter can still be used to enter newlines in the dialog)
- Improvement: The xrefs filter text showed the number of filtered items instead of the number of shown items
- Improvement: “Show Address” setting now enabled by default in graph view
- Improvement: “Create All Members” no longer shadows inherited members
- Improvement: Hex view no longer allows selection outside of the available content
- Improvement: When “Copy-As” fails, the error messages are now more helpful as to why the selection didn’t work
- Improvement: Modifying an offset far into an array no longer snaps to the top of the array after the change is done
- Improvement: Long Log window messages are now line wrapped
- Improvement: Hovering over a DataVariable which contained a function pointer now shows the function preview
- Improvement: “Open in New Pane” added to components context menu
- Improvement: Hex view shows the current offset even when the pane isn’t focused
- Fix: Several bugs related to fonts and in particular font aliasing on Windows 10 HiDPI monitors
- Fix: Large address spaces now properly render comments and tags
- Fix: Comments break inline and popup editing
- Fix: Copy from the log window sometimes copied extra lines
- Fix: Select enumeration dialog sometimes showed up empty, or selecting the wrong element
- Fix: Feature Map now is synchronized properly with multiple panes including if search results are selected
- Fix: Log window no longer incorrectly calculates widths
- Fix: Log window font spacing
- Fix: Upstream QT resolved default window location slowly migrating
- Fix: Renaming structure members was not possible on ARM/Thumb binaries
- Fix: Reset filters fixed for component view
- Fix: Enum members sometimes rendered incorrectly
- Fix: Disassembly view sometimes had the wrong type annotations
- Fix: Crash in enumeration rendering
- Fix: Some HLIL calls were not able to have set stack adjustment set
- Fix: Rename type had the wrong title
- Fix: Example placeholder in Import Header Dialog
- Fix: Pinch to zoom on MacOS was slightly off-center
- Fix: Sticker header is less confused about itself
- Fix: Strange highlighting around selected string literals
- Fix: Show/Hide Feature Map action wasn’t context sensitive
- Fix: Text search in the UI could produce inconsistent results due to not waiting for generated analysis when searching all functions
- Fix: Multiple issues were resolved related to non-ascii characters in both script files and user folder paths
- Fix: Spurious warning when using
show_html_report - Fix: Cross reference arrows direction in table view
- Fix: Potential hang when editing bytes with split linear/hex views both shown
- Fix: A regression where addresses in the log window weren’t clickable
Binary View Improvements
- Fix: MachO files without symbol information now properly load
- Fix: Objective-C workflow fixes some cfstrings not rendering
Analysis
- Feature: Functions can be marked as
__pure - Improvement: Large files with many relocations are now analyzed much more quickly
- Improvement: Inlined strings now have a type associated
- Improvement: Multiple improvements to dead-code elimination behavior
- Improvement: Synthetic builtins no longer obscure structure member assignments
- Improvement: Builtin memcpy shows all bytes as escaped hex
- Improvement: Better cross-references for thumb/arm functions
- Improvement: Backward compatibility for synthetic builtin outlining
- Improvement: Analysis of stack data initialized across basic block boundaries
- Improvement: Overly zealous function recognizer now less zealous
- Improvement: Duplicate symbol table entries are now ignored
- Improvement: Changing a data value now automatically updates analysis for dependent variables
- Improvement: Many template simplifier changes and updates (including improved over loaded operator simplifications!)
- Fix: Multiple fixes to PDB support including fixed rendering of symbols prefixed with 0x7f, RTTI type parsing, and an issue with caching of downloaded PDBs
- Fix: Removed some wide string detection false positives
- Fix: Fixed alignment when parsing __packed on windows targets
- Fix: Synthetic builtins now have the correct parameters and byte count and properly update
- Fix: Possibility for an infinite loop in linear sweep
- Fix: Deadlock in signature matching
- Fix: Crash (stack exhaustion) in outline resolver
- Fix: maxFunctionSize limit of 0 previously
- Fix:
analysis.limits.maxFunctionSizeis consistent and0causes it to be ignored, not for analysis to skip all functions (if previously using this to skip analysis, use theanalysis.initialAnalysisHoldsetting)
API
- Feature:
ReadPointerAPI added to BinaryReader - Feature: Now possible to iterate a DataVariable
- Feature:
AnalysisContextAPI added (thanks JJTech!) - Feature: New exception-safe undo API
BinaryView.undoable_transaction() - Improvement: Multiple improvements to the undo APIs and documentation (1, 2, 3)
- Improvement: py.typed is now included in shipped builds
- Improvement: binaryninjacore.h is now valid C (instead of C++)
- Improvement: Export header file better handles several edge cases to always produce parsable C
- Improvement:
open_view/loaderror messages are much more helpful and the APIs themselves are now more consistent with opening in the UI - Feature: TypedDataAccessor now has an iterator for easier printing
- Fix: Multiple improvements (1, 2, 3) to
parse_expression - Fix: Enumerate values via type API have correct signedness
- Fix:
loadAPI works correctly with raw bytes - Fix: Undoing removing a function properly restores all related annotations
- Fix: Expression Parser APIs obey file endianness (used in the GoTo dialog box)
Architectures
- Feature: Support for R_MIPS_REL32 relocations , and several other major PLT improvements on MIPS
- Improvement: LWL/LWR lifted on MIPS
- Improvement: UBFX lifted in Thumb
- Improvement: Thumb IT instruction lifting
- Improvement: Automatic detection of MIPS64 in ELF files
- Improvement: MIPS64 coprocessor and additional lifting
- Improvement: ARMv7 SXTH lifting
- Fix: movsb/stosb lifting had an incorrect byte count
- Fix: Lifting of MOV offset base uses an LLIL_CONST_POINTER even if the const is a symbol
- Fix: ROL/SHL instructions now work with constant propogation
- Fix: Incorrect ARMv7 BFI lifting
- Fix: R_AARCH64_CALL26 no longer breaks after rebasing
- Fix: A bug in the
__ptr_offsetannotation
Type Libraries / Platforms
- Feature: Platforms can now provide a _start prototype
- Feature: Referencing a type from a type library will maintain mappings to the library
- Fix: MIPS type libraries were in the wrong folder
Debugger
- Feature: Add DbgEng TTD support
- Improvement: Add a new menu entry to view register value in a new pane
- Improvement: Avoids triggering a full analysis of the function if the LLIL is unavailable
- Improvement: DbgEng adapter prints the target status after the target stops
- Improvement: Sending an empty input from the debugger console repeats the last command
- Improvement: Keep the debugger console focused after running a command
- Fix: Crash when opening non-ascii filenames
- Fix: LLDB adapter properly reports the width of the registers
- Fix: DbgEng TTD hides YMM and ZMM registers whose values are always empty
- Fix: crashes when opening a database if the last used debug adapter is unavailable
Enterprise
- Improvement: The “Open with Options” is now automatically skipped if you are uploading an existing
.bndbfile (it will still show by default if you are uploading a new binary) - Improvement: Right-click menu, Actions menu, and Command Palette now all include the same actions for the remote browser and may now be bound to hotkeys
- Improvement: Folders can now have descriptions, too
- Improvement: Documented a number of edge-cases customers have hit during server deployment and clarified instructions around setting up custom SSO providers
- Improvement: Enterprise API documentation now included in https://api.binary.ninja/
- Fix: Reanalysis no longer triggers on sync if no new content was merged in
- Fix: The analysis cache is no longer downloaded if it’ll be discarded by your client anyway for being out-of-date
- Fix: The analysis cache is no longer uploaded if it’s invalid anyway due to a merge
- Fix: Uploading a database no longer holds that database open after upload
- Fix: Folder state and contents are now properly updated on refresh
- Fix: Sync state now updates immediately when switching between files
- Fix: Crash when sorting folders in specific circumstances
- Fix: File extensions of uploaded files are no longer stripped
- Fix: “Edit Remote” dialog now has a minimum size
- Fix: Navigation no longer breaks if you open more than one “Remote Browser” tab
Documentation
- Feature: UIDF is now documented
- Feature: Documentation on function/start/size concepts
- Feature: Better documentation on writing UI plugins
- Improvement: Setting for Unicode code blocks now includes “UTF” to improve discoverability
- Fix:
.calleesdocumentation corrected
Miscellaneous
- Improvement: Several improvements to linux-setup.sh script
- Improvement: Both UI and APIs type parsing are now more lenient about trailing
;characters - Improvement: Transformations now work on views without default architectures without a warning
- Improvement: When the demangler specifies a type that doesn’t exist, temporary empty structs/types will be created
- Improvement: Python 3.11 will be automatically added to the settings list for possible interpreters if found
- Fix: Beta database_viewer plugin was subject to a race condition on load
- Fix: When pointer text tokens were negative, the leading
0xcould be omitted - Fix: PseudoC could have unbalanced parenthesis
…and, of course, all of the usual “many miscellaneous crashes and fixes” not explicitly listed here. Check them out in our full milestone list: https://github.com/Vector35/binaryninja-api/milestone/13?closed=1
如有侵权请联系:admin#unsafe.sh