2022-5-11 17:56:0 Author: naehrdine.blogspot.com(查看原文) 阅读量:2 收藏
There are a few configurations that I apply to almost every research iPhone. While these methods are documented publicly, the information is at many different places. Driven by laziness to search them on the Internet every time, I document them here, hoping that it also helps other researchers :)
Logs
Increase log level
For many targets, Apple has predefined debug profiles. They will print contents to log messages that otherwise only show <private>. These profiles are publicly available.
Following this post one can also show all <private> logs with the following change:
iPhone# vim /Library/Preferences/Logging/com.apple.system.logging.plist
<?xml version="1.0" encoding="UTF-8"?>
<!DOCTYPE plist PUBLIC "-//Apple//DTD PLIST 1.0//EN" "http://www.apple.com/DTDs/PropertyList-1.0.dtd">
<plist version="1.0">
<dict>
<key>Enable-Private-Data</key>
<true/>
</dict>
</plist>
iPhone# killall -9 logd
Of course, this requires a jailbroken iPhone, whereas debug profiles work on any device.
Logging Bluetooth packets
A great debug profile is the Bluetooth debug profile. All Bluetooth developer tools by Apple are linked on the site https://developer.apple.com/bluetooth.
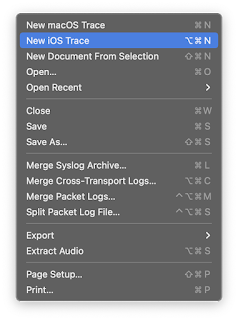
Install the Bluetooth debug profile to your iPhone. The profile can be airdropped or downloaded and then activated in the settings. Then, on a MacBook, run the Additional Tools for Xcode. In the Hardware folder, the PacketLogger can now also record packet traces on iOS. After saving these traces, they are also compatible with Wireshark.
debugserver
Enhancing debugserver privileges
Apple has a debugserver meant to work with Xcode for regular app debugging. Debugging any process with debugserver is possible after moving it from the developer disk image to the main disk and providing it with more entitlements. IDA Pro can use the debugserver to debug these processes then.
Minimal setup for debugserver works as follows:
cp /Developer/usr/bin/debugserver /usr/bin/debugserver
ldid -Sdebugserver_ent.xml /usr/bin/debugserver
<?xml version="1.0" encoding="UTF-8"?>
<!DOCTYPE plist PUBLIC "-//Apple//DTD PLIST 1.0//EN" "http://www.apple.com/DTDs/PropertyList-1.0.dtd">
<plist version="1.0">
<dict>
<key>com.apple.backboardd.debugapplications</key>
<true/>
<key>com.apple.backboardd.launchapplications</key>
<true/>
<key>com.apple.diagnosticd.diagnostic</key>
<true/>
<key>com.apple.frontboard.debugapplications</key>
<true/>
<key>com.apple.frontboard.launchapplications</key>
<true/>
<key>com.apple.security.network.client</key>
<true/>
<key>com.apple.security.network.server</key>
<true/>
<key>com.apple.springboard.debugapplications</key>
<true/>
<key>com.apple.system-task-ports</key>
<true/>
<key>get-task-allow</key>
<true/>
<key>platform-application</key>
<true/>
<key>run-unsigned-code</key>
<true/>
<key>task_for_pid-allow</key>
<true/>
</dict>
</plist>
Entitlements are subject to change. If it doesn't work, check this online again.
Note that as of May 2022, Frida has a bug where it loads a file from disk when attaching to a process. This violates sandboxes of some process. They will be killed with the following error message:
Exception Type: EXC_CRASH (SIGKILL)
Exception Codes: 0x0000000000000000, 0x0000000000000000
Exception Note: EXC_CORPSE_NOTIFY
Termination Reason: Namespace SANDBOX, Code 0x1
This log can be found in /var/mobile/Library/Logs/CrashReporter/ on the iPhone.
Attaching with the debugserver or lldb still works. Not a clean workaround but one of the many reasons why having different tooling for the same job can be important :)
Directly connecting to debugserver with lldb
On the iPhone, attach to the process with debugserver:
debugserver 0.0.0.0:3456 -a bluetoothd
On a MacBook, forward the port and then connect with lldb.
$ iproxy 4567 3456
$ lldb
(lldb) platform select remote-ios
Platform: remote-ios
Connected: no
SDK Path: "/Users/user/Library/Developer/Xcode/iOS DeviceSupport/15.3 (19D49) arm64e"
... (long list)
(lldb) process connect connect://localhost:4567
Process 683 stopped
* thread #1, queue = 'com.apple.main-thread', stop reason = signal SIGSTOP
frame #0: 0x00000001af43a908 libsystem_kernel.dylib`mach_msg_trap + 8
libsystem_kernel.dylib`mach_msg_trap:
-> 0x1af43a908 <+8>: ret
libsystem_kernel.dylib`mach_msg_overwrite_trap:
0x1af43a90c <+0>: mov x16, #-0x20
0x1af43a910 <+4>: svc #0x80
0x1af43a914 <+8>: ret
Target 0: (bluetoothd) stopped.
(lldb) c
Process 683 resuming
Note that the platform connect command is not supported with lldb, and you will get the following error message:
error: attach failed: invalid host:port specification: '[localhost]'
Integrating debugserver with VirtualBox
For some setups, it can be helpful to have the debugging setup not on your main host but within VirtualBox. You then need to forward the debugserver ports as follows:
- On the host, add a host only interface to VirtualBox (if not existent).
localhost# VBoxManage hostonlyif create
- On the iPhone, attach to a process.
iPhone# debugserver 0.0.0.0:3456 -a CommCenter
- Forward this port of debugserver to the VirtualBox network. IP addresses might differ.
localhost# iproxy 4567 3456 -s 192.168.56.1
Memory limits
When attaching to a process for Fuzzing, e.g., with Frida, it easily happens that the process exceeds its memory limits. For processes with a strict memory limit, already running frida-trace can exceed limits. In this case, the memory manager Jetsam will kill the process.
Adjust daemon limits
There are global settings for daemons that can be edited, see this fuzzing setup. Jetsam limits are configured in plist files in /System/Library/LaunchDaemons/. These can be edited with plistutil. The highest priority is 19, and memory limits can be adjusted as well:
<dict>
<key>ActiveSoftMemoryLimit</key>
<integer>24000</integer>
<key>InactiveHardMemoryLimit</key>
<integer>24000</integer>
<key>EnablePressuredExit</key>
<false/>
<key>JetsamPriority</key>
<integer>19</integer>
</dict>
Adjust app limits
There's a tool called jetsamctl. I recently tested it on jailbroken iOS 14.2 on an iPhone 12 and it still works. Use this to set memory limits on apps during runtime.
Symbols via developer disk image
Frida can only trace system libraries (DYLD shared cache) with symbols if the device is ready for development. The easiest way to achieve this is to connect the iPhone to a Mac with Xcode, click Devices and Simulators, and wait until the device is ready for development.
In this tab, logs can also be symbolicated if needed, e.g., if a crash log was produced but not symbolicated by Frida. It is possible to symbolicate a single crash log by hand without waiting for Xcode by calling this command:
/Applications/Xcode.app/Contents/SharedFrameworks/DVTFoundation.framework/Versions/A/Resources/symbolicatecrash
It's a good idea to alias this to symbolicate or similar.
Something is missing?
If there's some configuration that you add to all your research phones, feel free to add this in the comments. I might add other blog posts about how to work with Apple's firmware and kernel, but these are quite different to work with.
如有侵权请联系:admin#unsafe.sh

