2022-7-12 07:22:55 Author: randomascii.wordpress.com(查看原文) 阅读量:5 收藏
While investigating some performance mysteries in Chrome I discovered that Microsoft had parallelized how they zero memory, and in some cases this was making it a lot slower. This slowdown may be mitigated in Windows 11 but in the latest Windows Server editions – where it matters most – this bug is alive and well.
The good news is that this issue seems to only apply to machines with a lot of processors. By “a lot” of processors I mean probably 96 or more. So, your laptop is fine. And, even the 96-processor machines may not hit this problem all the time. But I’ve now found four different ways to trigger this inefficiency and when it is hit – oh my. The CPU power wasted is impressive – I estimate that memory zeroing is using about 24x the CPU time it should.
Okay – time for the details.
As usual, I was minding my own business. A bug had been filed suggesting that Chrome download speeds (such as those measured by speedtest.net) seemed to be affected by some anti-virus software. It looks like this can happen. Downloads go through the cache, the cache is saved to disk, and saves to disk are slowed by (some) anti-virus software. Case closed. But I noticed something…
I’d been testing on a virtual machine in a data center that I had access to, purely because this machine has an internet connection that runs at over 2 Gbps. By doing a speedtest run that got more than 2 Gbps (download and upload) I’d proved that Chrome was not intrinsically limiting download speeds. But I’d also recorded an ETW trace to understand where CPU time in the Network Service utility process was going, and I’d noticed some time being spent in ntoskrnl.exe!KiPageFault:
This function is called when newly allocated memory is touched for the first time – memory gets faulted in on demand (thus not consuming any physical memory if it isn’t touched). A bit of soft page faulting is fine, but I’d noticed that the CacheThread_BlockFile thread in that process was spending 16% of a core (2,422 ms out of 15.1 s) in these page faults. Maybe that’s unavoidable when downloading data at that rate, but often it can be avoided by reusing blocks of memory.
These page faults – often called demand-zero page faults because they fault in zeroed pages – are just one indication of the hidden costs of allocating memory from the OS (VirtualAlloc, but not small malloc allocations). Conveniently enough I’d blogged about these hidden costs already. So I consulted the wisdom of past me and I found this table that summarizes the hidden costs of allocating memory:
 Ah, past me. What would I do if you hadn’t written down all these useful facts and techniques that I so often forget? These were just the numbers that I needed. The best part about blogging is using a Google search to summon your previous research. But I digress…
This table told me that if I’m spending 16% of a core on page faults then I’m probably also spending – hidden in the System process – about 13.7% of a core on zeroing memory.
This extra cost is because when the pages are released back to the OS then Windows zeroes them out. This is so that it can hand them out to other processes without leaking information. On Windows 7 there was a dedicated thread for zeroing memory, but sometime in Windows 10 the memory zeroing task was multithreaded.
Page zeroing reality check
I took a quick look in the trace data to see how much CPU time was being consumed in the various MiZeroLargePageThread threads in the System process.
Note: that’s not the name of the threads, because the Windows kernel still doesn’t name its threads, five years after the API for doing so was added. That’s just the name of the entry point. Maybe some day…
I was shocked. The system process was using an average of just over four cores worth of CPU time to zero the freed memory!
Now, it turns out that there were other processes that were doing transient VirtualAlloc allocations, so the total amount of memory to be zeroed was about twice what I initially thought (yes, the UIforETW traces record all VirtualAllocs by default – handy). But. Still. Four cores worth of CPU time when I was expecting about 0.28 cores worth of CPU time seems like a lot. The total amount of CPU time was about 60 CPU seconds over 15 wall-time seconds, all this just to zero about 8.6 GB of memory. That is glacially slow.
The underpinning of the spinning
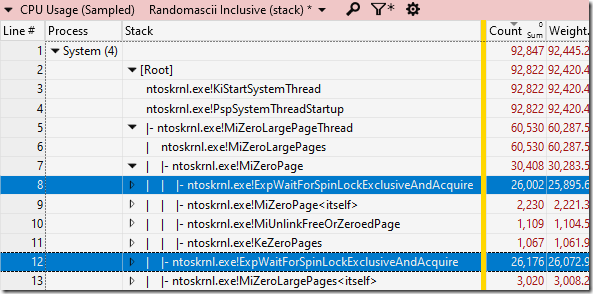
A few seconds of looking at the MiZeroLargePageThread threads made the problem clear. They were, in fact, spending very little time zeroing memory. They were spending the vast majority of their time in ntoskrnl.exe!ExpWaitForSpinLockExclusiveAndAcquire. The system process was using 92.445 s of CPU time, with 60.287 s of that under MiZeroLargePageThread, and of that 51.967s of CPU time was waiting for a spin lock.
Now I’m not a kernel developer but I’m pretty sure if you’re spending most of your time in a function with WaitForSpinLock in its name then something bad has happened. As somebody wise once said, spin locks waste energy and CPU power and should be avoided.
A bit of rearranging of summary tables (which would have been way easier with named threads!) let me see that the OS on my 96-kernel machine was devoting at least 39 threads to zeroing of memory. The trouble is, it looks like these threads are grabbing one piece of work at a time, where each piece of work is to zero a 4 KiB chunk of memory. Modern CPUs have memory bandwidths in the range of 50+ GB/s, so zeroing 4 KiB of memory could take as little as 76 ns.
But actually, the zeroing is initially done to the cache, so zeroing 4 KiB of memory could take just a dozen or so ns. That means that the spin-lock that protects the list of work is getting hit by 39+ threads, each of which could come back to the spin lock after about a dozen ns. It’s safe to assume that the cacheline that contains the spin lock is spending the majority of its time bouncing between CPU cores and packages.
As a rough rule of thumb if you have N worker threads then I would say that you need to spend at least N times as long processing a work packet as you spend acquiring and holding the lock that protects the work queue. With 39+ worker threads I’d guess you need to grab 200-500 ns worth of work, and it looks like these threads are not doing that.
How slow can we go?
That’s some lovely pathological behavior. But can we make it worse? I was able to trigger this inefficient behavior accidentally, just by using a web page – what if I tried to make it happen?
After some experimentation I found that two processes, each spinning in an 800,000 iteration loop that allocated/zeroed/freed 4 KiB chunks of memory (using VirtualAlloc/VirtualFree) worked to my satisfaction (code is here):
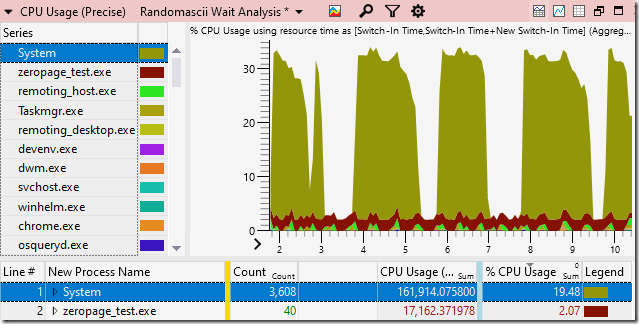
The zeropage_test.exe processes (brownish-red) are allocating, zeroing, and freeing memory. The System process (olive color) is doing nothing except zeroing the same memory. The System process is doing less work, but it is consuming almost ten times as much CPU time to do it. The system process manages to consume 29 processors (!!!) just zeroing a few GB of memory. It’s so beautifully terrible.
I called for help on twitter and got traces from a 128-logical-processor machine showing similar results. And, I started paying attention as I continued working on this machine, and I kept finding new ways to trigger the problem. A Python script for measuring disk performance triggered this bug as it allocated and freed 2 GiB blocks of memory. Using memmap’s Empty Standby List functionality triggered it – and the emptying of the standby list seemed to run much slower because of this. When doing a build of Chrome I noticed that CPU usage in the System process spiked up as high as 25% – that suggests that up to 24 logical processors may have been busy trying to zero memory freed by our many build processes.
I’ve crunched the numbers various ways and my best guess is that the parallel algorithm for zeroing memory pages on Windows 10 may consume more than 150 (!!!) times as much CPU time as the old serial algorithm did. Since it is using 39 threads this suggests that it is both more CPU/power wasteful, and also takes more wall time to complete its task. Data centers tend to be power limited, and presumably nobody buys a 96-core CPU so that many of its cores can do non-productive work. In one of the worst cases the System thread used over 162 s of CPU time to zero 6.13 GiB of RAM, for a write speed of just .038 GB/CPU-second!
So, what is an OS developer to do?
Suggestions
Well, I don’t know the kernel internals, so I might be way off base, but here are some ideas:
- Use fewer threads. One thread was actually pretty good. Start small and maybe go to two threads. Honestly, if software is freeing memory so quickly that a couple of threads can’t keep up with the zeroing then maybe that software should be fixed. And, if the zeroing threads fall behind that’s actually fine – the pages can be zeroed when they are faulted in to processes instead – Windows has always supported that. Note that somebody with a kernel debugger attached could suspend most of the page-zeroing thread in the system process and see if this solves the problem – I think it would.
- Have the threads grab more work. Some papers have suggested that when a thread acquires the work-queue lock it should grab half of the work remaining. Alternately, if you have N threads fighting over the same lock then you need the job size to be proportionally bigger to avoid pathological contention, so maybe have each worker thread grab N (or 2*N) pages at a time.
- Don’t use spin locks. I think spin locks are just evil. The old wisdom used to be that spinlocks have no place in userspace, but it may be time to upgrade that wisdom because apparently kernel developers also abuse them. KeAcquireInStackQueuedSpinLock is the non-spinny function of choice in kernel land.
- Do all of the above. Four worker threads, each grabbing larger chunks of work, and using a non-spin-lock, might actually be beautiful.
Windows 11
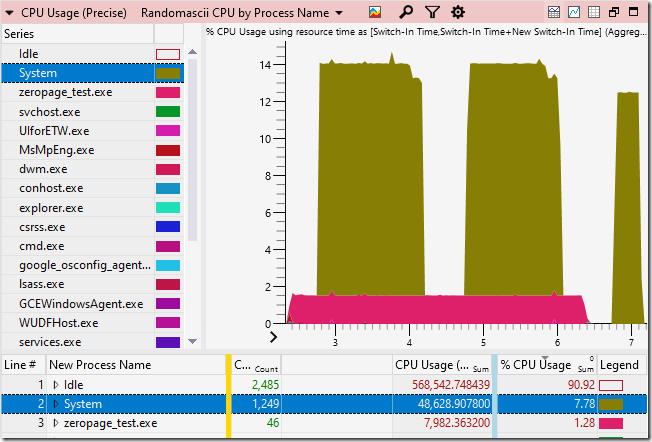
I eventually managed to get some test results on Windows 11 (thanks!) on a 128-logical-processor machine and they are encouraging. Microsoft appears to have improved things significantly. Here is the memory zeroing on that machine with the same zeropage_test.exe stress test:
The zeroing threads used much less CPU in this test. The OS now appears to just use twelve threads (this is uncertain), and it uses ntoskrnl.exe!KeAcquireInStackQueuedSpinLock to reduce spinning. I can’t tell if the worker threads are grabbing large chunks of data.
However, more work is needed. The memory zeroing code still seems to be spending about 80% of its CPU time spinning for locks. Since the KeAcquireInStackQueuedSpinLock and ExpWaitForSpinLockExclusiveAndAcquire functions cannot be used on the same lock this suggests that there are two (or more) locks in play and Microsoft only moved one of them to the queued variant. As their own documentation says:
Queued spin locks are a variant of spin locks that are more efficient for high contention locks on multiprocessor machines. On multiprocessor machines, using queued spin locks guarantees that processors acquire the spin lock on a first-come first-served basis. Drivers for Windows XP and later versions of Windows should use queued spin locks instead of ordinary spin locks.
So, yeah. Maybe the OS should start following this advice, or update the documentation to explain why not.
Server versions should be fine…
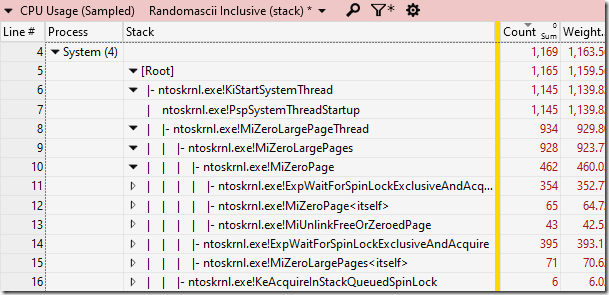
I then did one final test. I used Google Compute Engine (I couldn’t get Azure to work) to create a 128-logical-processor machine running Windows Server 2022 DataCenter. You’d think that if you were doing high-performance-computing on Windows then this would probably be the OS you would use so I was quite amused to see that it does not have the Windows 11 fixes (confirmed here). That’s $3.08 well spent. Here’s a trace from Microsoft’s latest server OS (you can download it from here):
This trace makes obvious something that I hadn’t really noticed before: the MiZeroLargePageThread threads wake up every two seconds to look for work. That doesn’t change any of the conclusions, but it does mean that these threads do nothing for a while and then simultaneously fight desperately for the chance to do some work – hurry up and wait.
Thanks to all those on twitter who responded to my vaguely worded call for help. It was wonderful to have multiple offers of 128 logical-processor machines, and even one person who offered up their 68×4 Xeon Phi machine – I didn’t realize that 272 logical-processor machines existed!
Reddit discussion is here
Hacker news discussion is here
Twitter discussion is here and here
Update, November 2022: I tested on Windows 10 22H2 and the problem is still there.
如有侵权请联系:admin#unsafe.sh


