‘Customer Insights‘ dashboard, first release: Support Entitlements.
As already written in my first blog post, the ‘Customer Insights‘ dashboard is a new interactive reporting in SAP for Me analyzing your SAP solutions across all products, support contracts and deployment types.
The first release of the new ‘Customer Insights‘ dashboard contains among other sections a section ‘Support Entitlements’ which will be introduced below in details.
You can access this section from the first overview page using the summary card for the Support Entitlements or the section “Support Entitlements” in the ‘Tab Menu’.
Support Entitlements details.
The purpose of this data section is to provide you with an overview of all your support entitlements including main contracts and additional premium support engagements (premium attributes). You can view which installations and which systems are covered by which support entitlement and sort and filter for the installations, systems or products of your interest. You also can see which account is the owner of the support entitlement in case a head company purchased additional support for its subsidiaries.

Support Entitlements overview
The default view starts with the subsection Support Entitlements ‘by Installations’ displaying your support entitlements valid for assigned installations with appropriate number of systems.
Graphs
The first graph shows the overview of the main support contracts like standard support, SAP Enterprise Support (ES), SAP Product Support for Large Enterprises (PSLE) and the premium engagements which can be purchased additionally on top of the main contract. As numbers you see how many installations are covered by the main contract or premium engagement (see screen above).
The second graph displays the main support contracts distribution between different ‘Product Categories’. So you can see which product group is covered by which support contract and where you have premium engagements (see screen above).
There is also a third graph available which is not displayed as default.

Support contracts owners
This graph shows the support contracts by contracts owners. In some cases the support contract owner (account which paid for support contract) is different to the account which uses the installations and systems covered by the support contract. But because it happens occasionally and is not the rule valid for all, this graph has been hidden in the default view and can be added if needed.
To add the graph, go to the ‘…’- menu on top of the card, select “Personalize Card” 
and switch on the graph ‘Contracts by Installation Owners’.

The graph will be displayed on the screen. If you want that this graph stays here also if you start the reporting next time, save your changes using the Variant management.

Save your variant
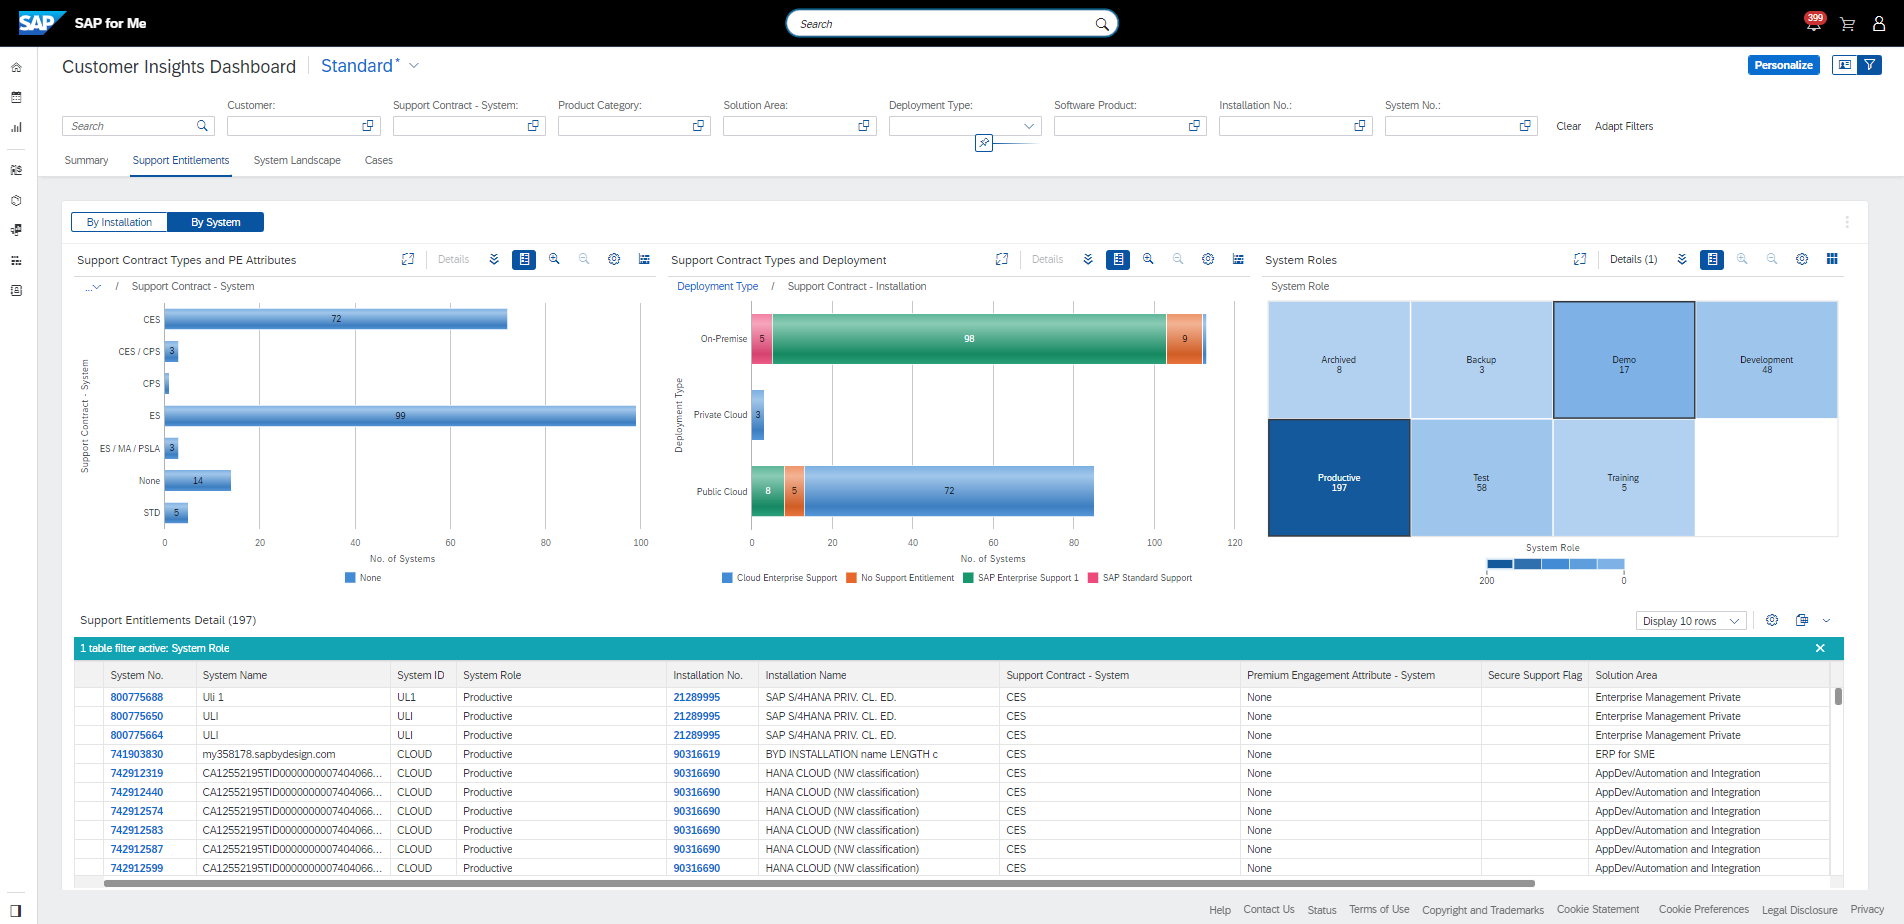
The second subsection ‘Contracts by Systems’ displays an overview on your support entitlements on the system level.
Here you can see exactly which systems are covered by which support entitlement and which premium engagements are available on the system level.
The third graph – Systems by System Type – is not displayed per default. This graph helps you to focus on a particular system group according to their status (production, development, test ect.).
If you add it using the ‘Personalization’ button as explained above, you can click on the section “Production Systems” in the new graph to see e.g. all productive systems and their relevant contracts with one click

Support Entitlements by Systems
.
Table
The table below the graphs displays the details to the graphs content and is the basis for the graphical visualization.
The graphs and the table are connected. If you select a segment in a bar chart the other graphs and table below will be adjusted and display the selected content only.
The table content can also be customized. Using the customization wheel icon above the table you can add additional fields as columns or remove the fields from the table view. Please note, if you add additional columns you might get additional lined to the table depending on the content of the columns.
Both – table and graphs – are responsive to the global filter on top of the screen.
Please use the ‘Feedback slider’ on the right edge of the page of the application to share with us your feedback on this new tool and help us to improve the reporting functionality in SAP for Me.
Stay updated by subscribing to this blog and visiting the SAP Support Portal / Customer Insights.
SAP for Me is made for you!
Related blogs:
如有侵权请联系:admin#unsafe.sh