2023-10-10 05:59:11 Author: blogs.sap.com(查看原文) 阅读量:8 收藏
Disclaimer- This Blog is to display the graphical representation of MTTR and MTBF in the SAP ECC. However, the better graphical analytical report is already available in S/4 HANA Fiori applications App ID – F2812
Requirement – To display the MTTR and MTBF of a specific maintenance plant.
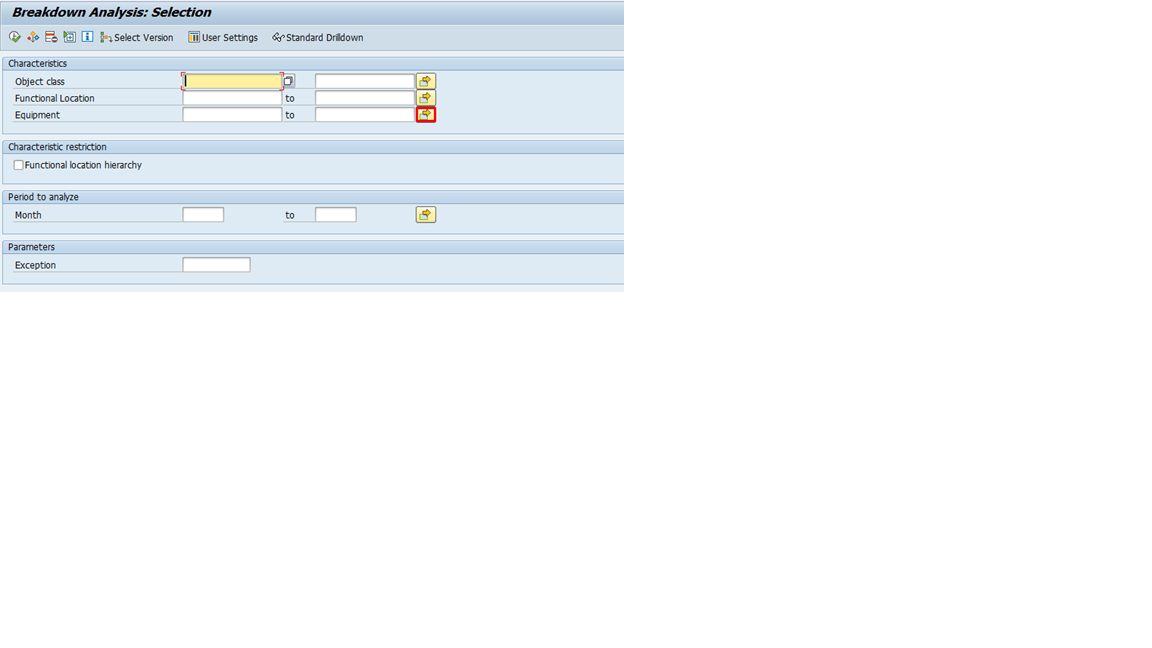
T-code :- MCI7
Click on Multiple section button to input all the equipments from a specific plant

Select multiple selection option to select multiple equipments from a specific plant, then click on equipment by equipment list option. Again click on maintenance plant multiple selection and mention only the required maintenance plants for which the report should be displayed and click on execute (F8) button.

All the Equipments from these plants will be displayed, now select all the equipments and click on continue button

Now click on execute button to display the MTTR and MTBF report for the selected equipments and hence for the required maintenance plant

Click on switch drilldown to display the report for each equipment of that plant


List of equipments is displayed with their respective MTTR and MTBF values

Now click on graphics or press F5 to get the graphical representation.

Output of the graphical representation is as below.

Click on overview to change dimension and choices


It can able be extracted in Microsoft Excel with below steps


Summary- To use the filter criteria effectively to display the graphical report for the MTTR and MTBF. The same filter criteria can be used for all the other PMIS reports of plant maintenance.
Thanks for reading this short blog. Please leave your feedback in the comment section.
Follow me for more such related blogs.
如有侵权请联系:admin#unsafe.sh