2023-12-6 16:0:0 Author: blog.nviso.eu(查看原文) 阅读量:17 收藏
Introduction
Security information and event management (SIEM) tooling allows security teams to collect and analyse logs from a wide variety of sources. In turn this is used to detect and handle incidents. Evidently it is important to ensure that the log ingestion is complete and uninterrupted. Luckily SIEMs offer out-of-the-box solutions and/or capabilities to create custom health monitoring. In this blog post we will take a look at the health monitoring capabilities for log ingestion in Microsoft Sentinel.
Microsoft Sentinel
Microsoft Sentinel is the cloud-native Security information and event management (SIEM) and Security orchestration, automation, and response (SOAR) solution provided by Microsoft. It provides intelligent security analytics and threat intelligence across the enterprise, offering a single solution for alert detection, threat visibility, proactive hunting, and threat response. As a cloud-native solution, it can easily scale to accommodate the growing security needs of an organization and alleviate the cost of maintaining your own infrastructure.
Microsoft Sentinel utilizes Data Connectors to handle log ingestion. Microsoft Sentinel comes with out of the box connectors for Microsoft services, these are the service-to-service connectors. Additionally, there are many built-in connectors for third-party services, which utilize Syslog, Common Event Format (CEF) or REST APIs to connect the data sources to Microsoft Sentinel.
Besides logs from Microsoft services and third-party services, Sentinel can also collect logs from Azure VMs and non-Azure VMs. The log collection is done via the Azure Monitor Agent (AMA) or the Log Analytics Agent (MMA). As a brief aside, it’s important to note that the Log Analytics Agent is on a deprecation path and won’t be supported after August 31, 2024.
The state of the Data Connectors can be monitored with the out-of-the-box solutions or by creating a custom solution.
Microsoft provides two out-of-the-box features to perform health monitoring on the data connectors: The Data connectors health monitoring workbook & SentinelHealth data table.
Using the Data connectors health monitoring workbook
The Data collection health monitoring workbook is an out-of-the-box solution that provides insight regarding the log ingestion status, detection of anomalies and the health status of the Log Analytics agents.
The workbook consists of three tabs: Overview, Data collection anomalies & Agents info.
The Overview tab shows the general status of the log ingestions in the selected workspace. It contains data such as the Events per Second (EPS), data volume and time of the last log received. For the tab to function, the required Subscription and Workspace have to be selected at the top

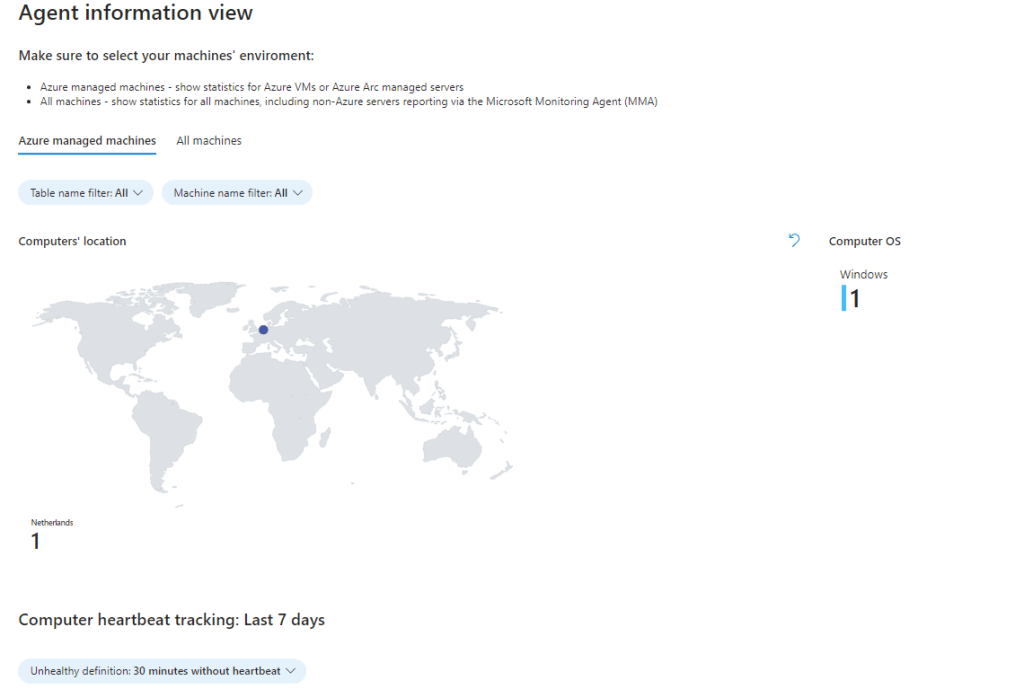
The Data collection anomalies tab provides info for detecting anomalies in the log ingestion process. Each tab in the view presents a specific table. The General tab is a collection of a multiple tables.
We’re given a few configuration options for the view:
- AnomaliesTimeRange: Define the total time range for the anomaly detection.
- SampleInterval: Define the time interval in which data is sampled in the defined time range. Each time sample gets an anomaly score, which is used for the detection.
- PositiveAlertThreshold: Define the positive anomaly score threshold.
- NegativeAlertThreshold: Define the negative anomaly score threshold.
The view itself contains the expected amount of events, the actual amount of events & anomaly score per table. When a significant drop or rise in events is detected, a further investigation is advised. The logic behind the view can also be re-used to setup alerting when a certain threshold is exceeded.
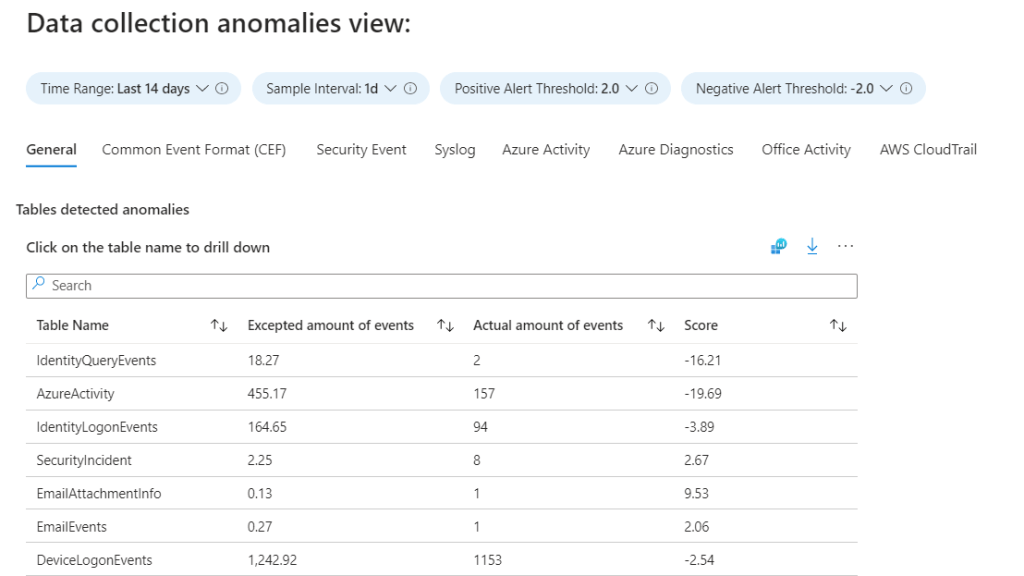
The Agent info tab contains information about the health of the AMA and MMA agents installed on your Azure and non-Azure machines. The view allows you to monitor System location, Heartbeat status and latency, Available memory and disk space & Agent operations. There are two tabs in the view to choose between Azure machines only and all machines.
You can find the workbook under Microsoft Sentinel > Workbooks > Templates, then type Data collection health monitoring in the search field. Click View Template to open the workbook. If you plan on using the workbook frequently, hit the Save button so it shows up under My Workbooks.
The SentinelHealth data table
The SentinelHealth data table provides information on the health of your Sentinel resources. The content of the table is not limited to only the data connectors, but also the health of your automation rules, playbooks and analytic rules. Given the scope of this blog post, we will focus solely on the data connector events.
Currently the table has support for following data connectors:
- Amazon Web Services (CloudTrail and S3)
- Dynamics 365
- Office 365
- Microsoft Defender for Endpoint
- Threat Intelligence – TAXII
- Threat Intelligence Platforms
For the data connectors, there are two types of events: Data fetch status change & Data fetch failure summary.
The Data fetch status change events contain the status of the data fetching and additional information. The status is represented by Success or Failure and depending on the status, different additional information is given in the ExtendedProperties field:
- For a Success, the field will contain the destination of the logs.
- For a Failure, the field will contain an error message describing the failure. The content of this message depends on the failure type.
These events will be logged once an hour if the status is stable (i.e. status doesn’t change from Success to Failure and vice versa). Once a status change is detected it will be logged immediately.
The Data fetch failure summary events are logged once an hour, per connector, per workspace, with an aggregated failure summary. They are only logged when the connector has experienced polling errors during the given hour. The event itself contains additional information in the ExtendedProperties field, such as all the encountered failures and the time period for which the connector’s source platform was queried.
Using the SentinelHealth data table
Before we can start using the SentinelHealth table, we first have to enable it. Go to Microsoft Sentinel > Settings > Settings tab > Auditing and health monitoring, press Enable to enable the health monitoring.
Once the SentinelHealth table contains data, we can start querying on it. Below you’ll find some example queries to run.
List the latest failure per connector
SentinelHealth
| where TimeGenerated > ago(7d)
| where OperationName == "Data fetch status change"
| where Status == "Failure"
| summarize TimeGenerated = arg_max(TimeGenerated,*) by SentinelResourceName, SentinelResourceId
Connector status change from Failure to Success
let success_status = SentinelHealth
| where TimeGenerated > ago(1d)
| where OperationName == "Data fetch status change"
| where Status == "Success"
| summarize TimeGenerated = arg_max(TimeGenerated,*) by SentinelResourceName, SentinelResourceId;
let failure_status = SentinelHealth
| where TimeGenerated > ago(1d)
| where OperationName == "Data fetch status change"
| where Status == "Failure"
| summarize TimeGenerated = arg_max(TimeGenerated,*) by SentinelResourceName, SentinelResourceId;
success_status
| join kind=inner (failure_status) on SentinelResourceName, SentinelResourceId
| where TimeGenerated > TimeGenerated1
Connector status change from Success to Failure
let success_status = SentinelHealth
| where TimeGenerated > ago(1d)
| where OperationName == "Data fetch status change"
| where Status == "Success"
| summarize TimeGenerated = arg_max(TimeGenerated,*) by SentinelResourceName, SentinelResourceId;
let failure_status = SentinelHealth
| where TimeGenerated > ago(1d)
| where OperationName == "Data fetch status change"
| where Status == "Failure"
| summarize TimeGenerated = arg_max(TimeGenerated,*) by SentinelResourceName, SentinelResourceId;
success_status
| join kind=inner (failure_status) on SentinelResourceName, SentinelResourceId
| where TimeGenerated > TimeGenerated1
Custom Solutions
With the help of built-in Azure features and KQL queries, there is the possibility to create custom solutions. The idea is to create a KQL query and then have it executed by an Azure feature, such as Azure Monitor, Azure Logic Apps or as a Sentinel Analytics Rule. Below you’ll find two examples of custom solutions.
Log Analytics Alert
For the first example, we’ll setup an alert in the Log Analytics workspace where Sentinel is running on. The alert logic will run on a recurring basis and alert the necessary people when it is triggered. For starters, we’ll go the the Log Analytics Workspace and and start the creation of a new alert.
Select Custom log search for the signal and we’ll use the Connector status change from Success to Failure query example as logic.
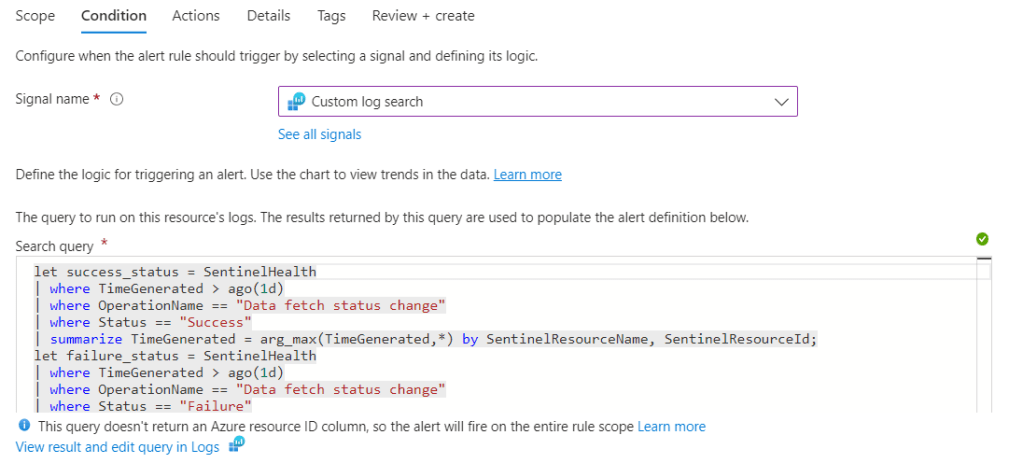
Set both the aggregation and evaluation period to 1hr, so it doesn’t incur a high monthly cost. Next, attach an email Action Group to the alert, so the necessary people are informed of the failure.

Lastly, give the alert a severity level, name and description to finish off.

Logic App Teams Notification
For the second example, we’ll create a Logic App that will send an overview via Teams of all the tables with an anomalous score.
For starters, we’ll create a logic app and create a Workflow inside the logic app.

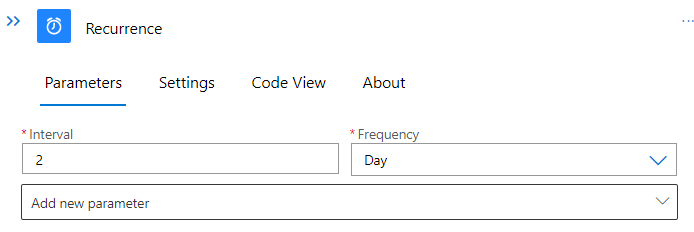
Inside the Workflow, we’ll design the logic for the Teams Notification. We’ll start off with a Recurrence trigger. Define an interval on which you’d like to receive notifications. In the example, an interval of two days was chosen.
Next, we’ll add the Run query and visualize results action. In this action, we have to define the Subscription, Resource Group, Resource Type, Resource Name, Query, Time Range and Chart Type. Define the first parameters to select your Log Analytics Workspace and then use following query. The query is based on the logic from the Data Connector Workbook. The query looks back on the data of the past two weeks with an interval of one day per data sample. If needed, the time period and interval can be increased or decreased. The UpperThreshold and LowerThreshold parameter can be adapted to make the detection more or less sensitive.
let UpperThreshold = 5.0; // Upper Anomaly threshold score
let LowerThreshold = -5.0; // Lower anomaly threshold score
let TableIgnoreList = dynamic(['SecurityAlert', 'BehaviorAnalytics', 'SecurityBaseline', 'ProtectionStatus']); // select tables you want to EXCLUDE from the results
union withsource=TableName1 *
| make-series count() on TimeGenerated from ago(14d) to now() step 1d by TableName1
| extend (anomalies, score, baseline) = series_decompose_anomalies(count_, 1.5, 7, 'linefit', 1, 'ctukey', 0.01)
| where anomalies[-1] == 1 or anomalies[-1] == -1
| extend Score = score[-1]
| where Score >= UpperThreshold or Score <= LowerThreshold
| where TableName1 !in (TableIgnoreList)
| project TableName=TableName1, ExpectedCount=round(todouble(baseline[-1]),1), ActualCount=round(todouble(count_[-1]),1), AnomalyScore = round(todouble(score[-1]),1)
Lastly, define the Time Range and Chart Type parameter. For Time Range pick Set in query and for Chart Type pick Html Table.
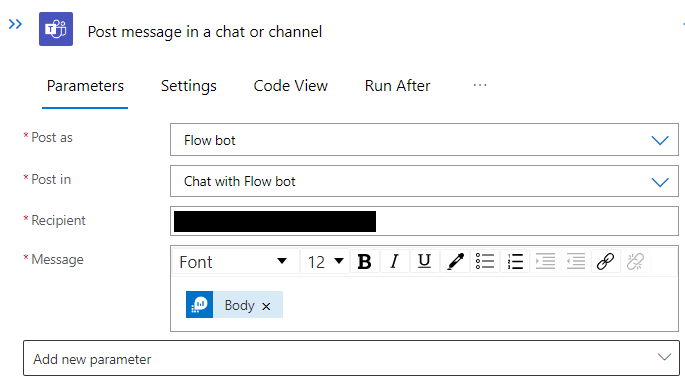
Now that the execution of the query is defined, we can define the sending of a Teams message. Select the Post message in a chat or channel action and configure the action to send the body of the query to a channel/person as Flowbot.
Once the Teams action is defined, the logic app is completed. When the logic app runs, you should expect an output similar to the image below. The parameters in the table can be analysed to detect Data Connector issues.

Conclusion
In conclusion, as stated in the intro, monitoring the health of data connectors is a critical part of ensuring an uninterrupted log ingestion process into the SIEM. Microsoft Sentinel offers great capabilities for monitoring the health of data connectors, thus enabling security teams to ensure the smooth functioning of log ingestion processes and promptly address any issues that may arise. The combination of the two out-of-the-box solutions and the flexibility to create custom monitoring solutions, makes Microsoft Sentinel a comprehensive and adaptable choice for managing and monitoring security events.

Frederik Meutermans
Frederik is a Senior Security Consultant in the Cloud Security Team. He specializes in the Microsoft Azure cloud stack, with a special focus on cloud security monitoring. He mainly has experience as security analyst and security monitoring engineer.
You can find Frederik on LinkedIn.
如有侵权请联系:admin#unsafe.sh