
10/31/2023
5 min read
This post is also available in Deutsch, Français, Español, 简体中文, 繁體中文, 日本語 and 한국어.

When it comes to managing Internet properties, the difference between a small technical hiccup and major incident is often a matter of speed. Proactive alerting plays a crucial role, which is why we were excited when we released HTTP Error Rate notifications — giving administrators visibility into when end users are experiencing errors.
But what if there are issues that don't show up as errors, like a sudden drop in traffic, or a spike?
Today, we're excited to announce Traffic Anomalies notifications, available to enterprise customers. These notifications trigger when Cloudflare detects unexpected changes in traffic, giving another valuable perspective into the health of your systems.
Unexpected changes in traffic could be indicative of many things. If you run an ecommerce site and see a spike in traffic that could be great news — maybe customers are flocking to your sale, or you just had an ad run on a popular TV show. However, it could also mean that something is going wrong: maybe someone accidentally turned off a firewall rule, and now you’re seeing more malicious traffic. Either way, you might want to know that something has changed.
Similarly, a sudden drop in traffic could mean many things. Perhaps it’s Friday afternoon and all of your employees are signing off and no longer accessing your company website. Or maybe a link to your site is broken, and now potential customers aren’t able to access it. You could be losing potential revenue every minute that traffic is low, so you’d want to know as soon as possible to investigate.
How can we tell when to alert?
Calculating anomalies in time series datasets is difficult to do well. The simplest way to do it is to use basic thresholds. However, as we’ve previously blogged about, simple thresholds aren’t very accurate when trying to determine when things are actually going wrong. There are too many edge cases for them to work effectively.
Calculating anomalies in HTTP errors is relatively easy. We know that in general there should be a very low number of errors, so any spike is bad and therefore alertable. That’s why we use Service Level Objectives (SLOs) to calculate anomalies for our HTTP Error Rate notifications.
However, analyzing overall HTTP traffic behaves more similarly to Cloudflare Security Events: there’s some general baseline of events that is computed from historical trends. Any deviation from that baseline is alertable. Because of those similarities, we decided to use the same calculations for Traffic Anomalies notifications as we have previously used for Security Event notifications: z-scores. This involves comparing the current value to the average over a period of time. However, many standard deviations away from the average the current value is, is the z-score.
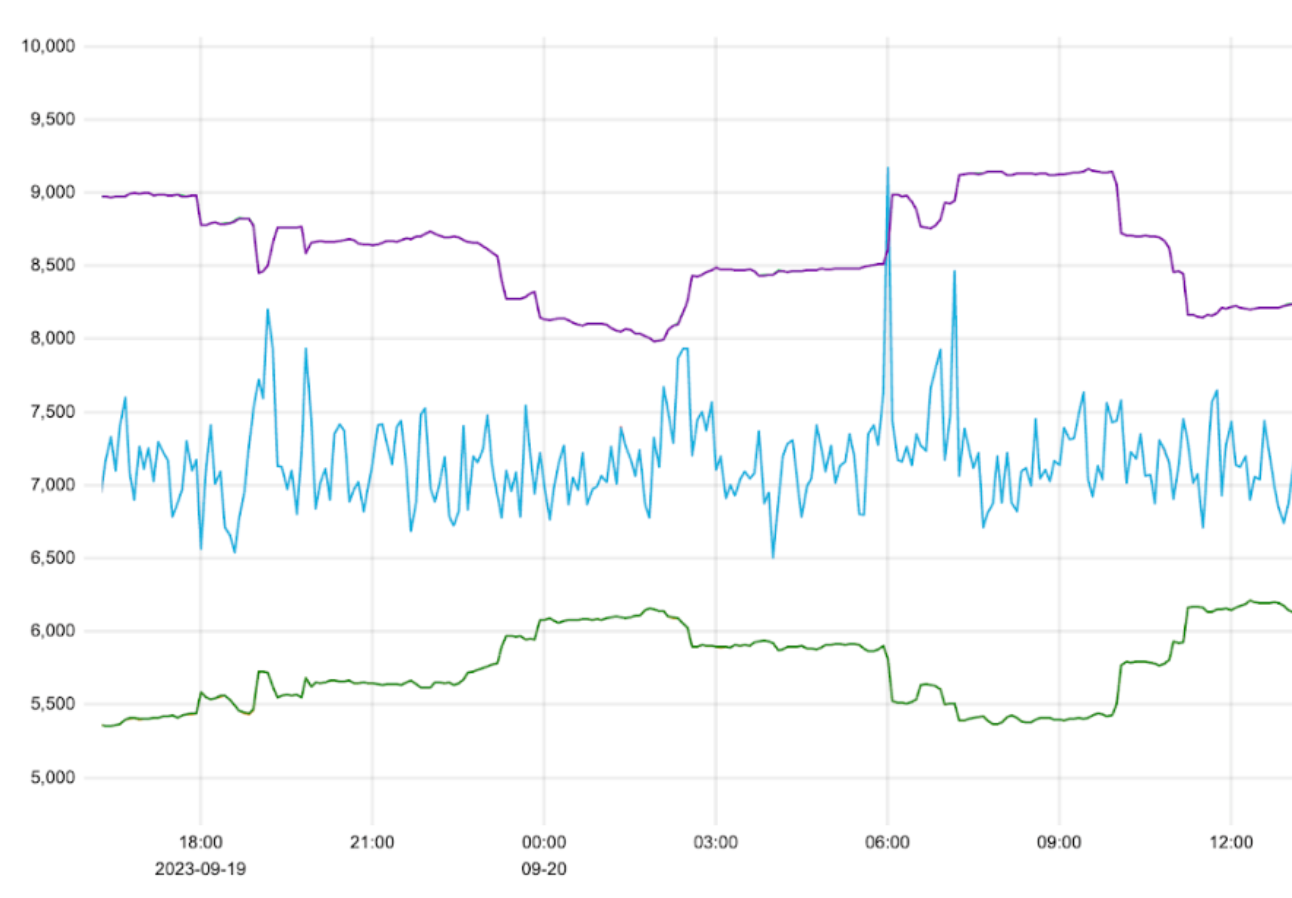
For Traffic Anomalies notifications, we’re comparing the traffic over the past 5 minutes (the short window) to the average of the traffic over the past 4 hours (the long window). Positive z-scores indicate a spike, and negative z-scores indicate a drop. If the current value is more than 3.5 standard deviations away from the average, we alert. We measure every 5 minutes, so we can alert on any traffic spike or drop in a timely fashion.

While our Security Event notifications only trigger when there is a spike in security events (a drop is almost always a good thing), in the case of Traffic Anomalies we send notifications for both spikes and drops. This is because a drop of HTTP traffic is likely indicative of a problem, and a surge could be good or bad.
As with Security Events, Traffic Anomalies notifications support minimum thresholds. This means that, even if we determine that an event is outside 3.5 standard deviations, if the number of events is insignificant, we don’t alert. A spike must be at least 200 requests, and a drop must fall by at least 200 requests. This makes the notifications less noisy, since we aren’t alerting on small spikes and drops.
Digging a little deeper
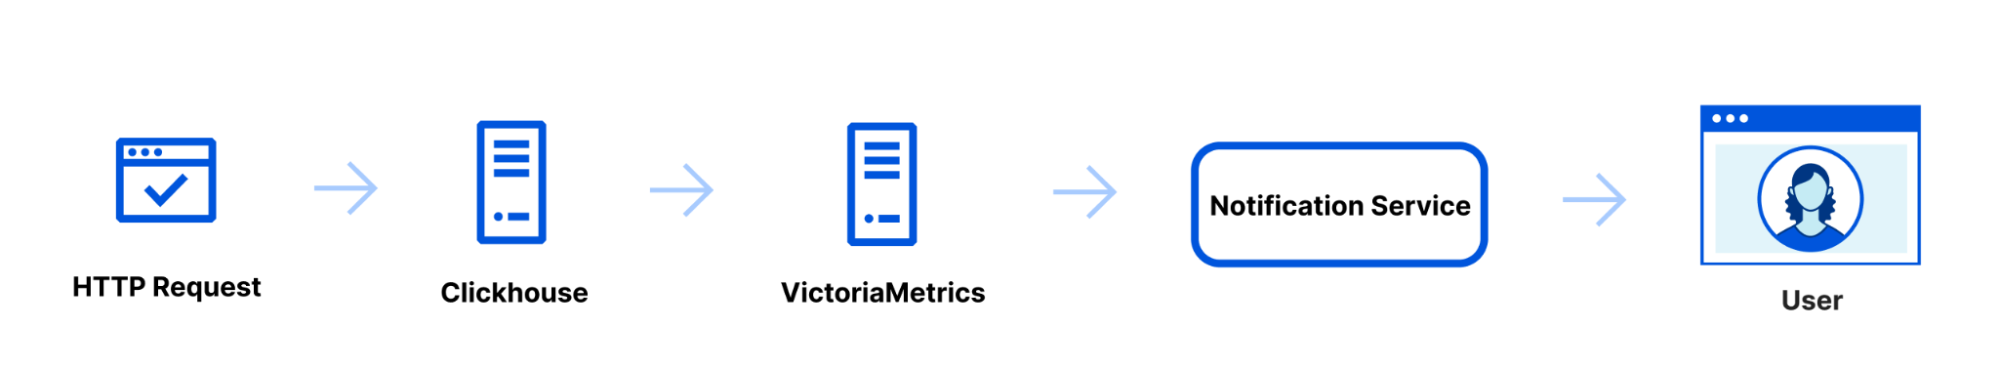
Cloudflare stores sampled statistics on requests that go through its network in Clickhouse. Every minute, we take HTTP traffic from Clickhouse and store it in an instance of VictoriaMetrics, a time-series data storage solution. VictoriaMetrics gives us out-of-the-box algorithmic functions for free, and it has been a good fit for our use case. We chose VictoriaMetrics for a few reasons.
Firstly, it's easy to configure and operate. As a team, we want to optimize for low operational burden and VictoriaMetrics has been great thus far. Secondly, VictoriaMetrics has the ability to scale horizontally, meaning we can run it in a highly available mode. For a system such as this where we want something reliable to compute time sensitive information for our customers, the high availability requirement is essential. Finally, in our tests, we found that VictoriaMetrics used around ⅓ of the memory that Prometheus, a similar alternative product, did for the same use case.
Once we have data in VictoriaMetrics, we can run queries against it and determine whether we need to alert our customers or not, based on notification configurations they have created ahead of time. To do this we leverage our existing Alert Notification System, which we blogged about initially in 2019. We know we can count on our current notification system for the last mile to deliver these critical notifications to our customers.
Setting up the Notification
To configure this notification, navigate to the “Notifications” tab of the dashboard. Select Traffic Anomalies as your notification type. As with all Cloudflare notifications, you’re able to name and describe your notification, and choose how you want to be notified.
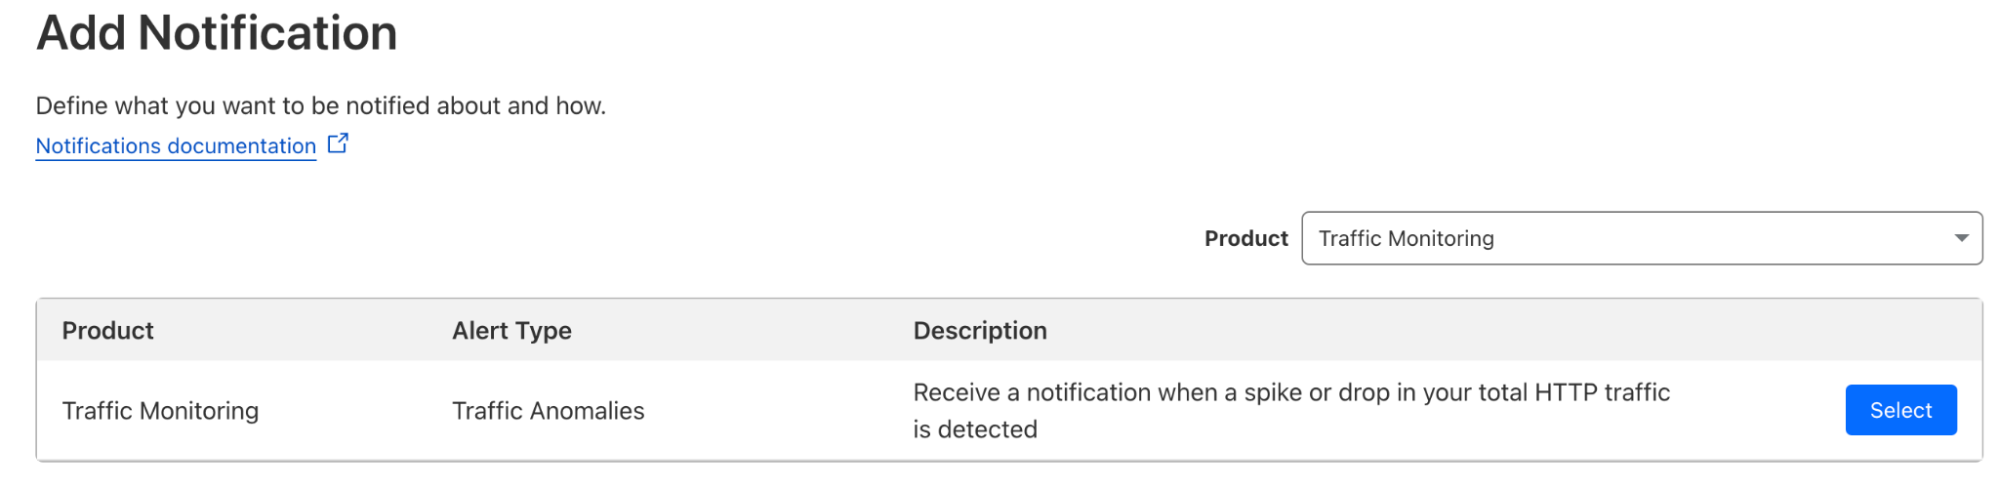
You can choose which domains you want monitored for Traffic Anomalies, whether you want to include traffic that’s already been mitigated by Cloudflare DoS or WAF products, and whether there are specific status codes you want included or excluded. You can also choose whether you want to be alerted on traffic spikes, drops, or both.
We’re excited to use this system to help serve our Enterprise customers with invaluable notifications regarding the overall health of their systems. Head over to the Notifications tab in the dash to check this new notification out now!
We protect entire corporate networks, help customers build Internet-scale applications efficiently, accelerate any website or Internet application, ward off DDoS attacks, keep hackers at bay, and can help you on your journey to Zero Trust.
Visit 1.1.1.1 from any device to get started with our free app that makes your Internet faster and safer.
To learn more about our mission to help build a better Internet, start here. If you're looking for a new career direction, check out our open positions.