How long does it take to read the time? How would you time time? These strange questions came to the fore back in 2014 when Netflix was switching services from CentOS Linux to Ubuntu, and I helped debug several weird performance issues including one I'll describe here. While you're unlikely to run into this specific issue anymore, what is interesting is this type of issue and the simple method of debugging it: a pragmatic mix of observability and experimentation tools. I've shared many posts about superpower observability tools, but often humble hacking is just as effective.
A Cassandra database cluster had switched to Ubuntu and noticed write latency increased by over 30%. A quick check of basic performance statistics showed over 30% higher CPU consumption. What on Earth is Ubuntu doing that results in 30% higher CPU time!?
1. CLI tools
The Cassandra systems were EC2 virtual machine (Xen) instances. I logged into one and went through some basic CLI tools to get started (my 60s checklist). Was there some other program consuming CPU, like a misbehaving Ubuntu service that wasn't in CentOS? top(1) showed that only the Cassandra database was consuming CPU.
What about short-lived processes, like a service restarting in a loop? These can be invisible to top(8). My execsnoop(8) tool (back then my Ftrace version) showed nothing.
It seemed that the extra CPU time really was in Cassandra, but how?
2. CPU profile
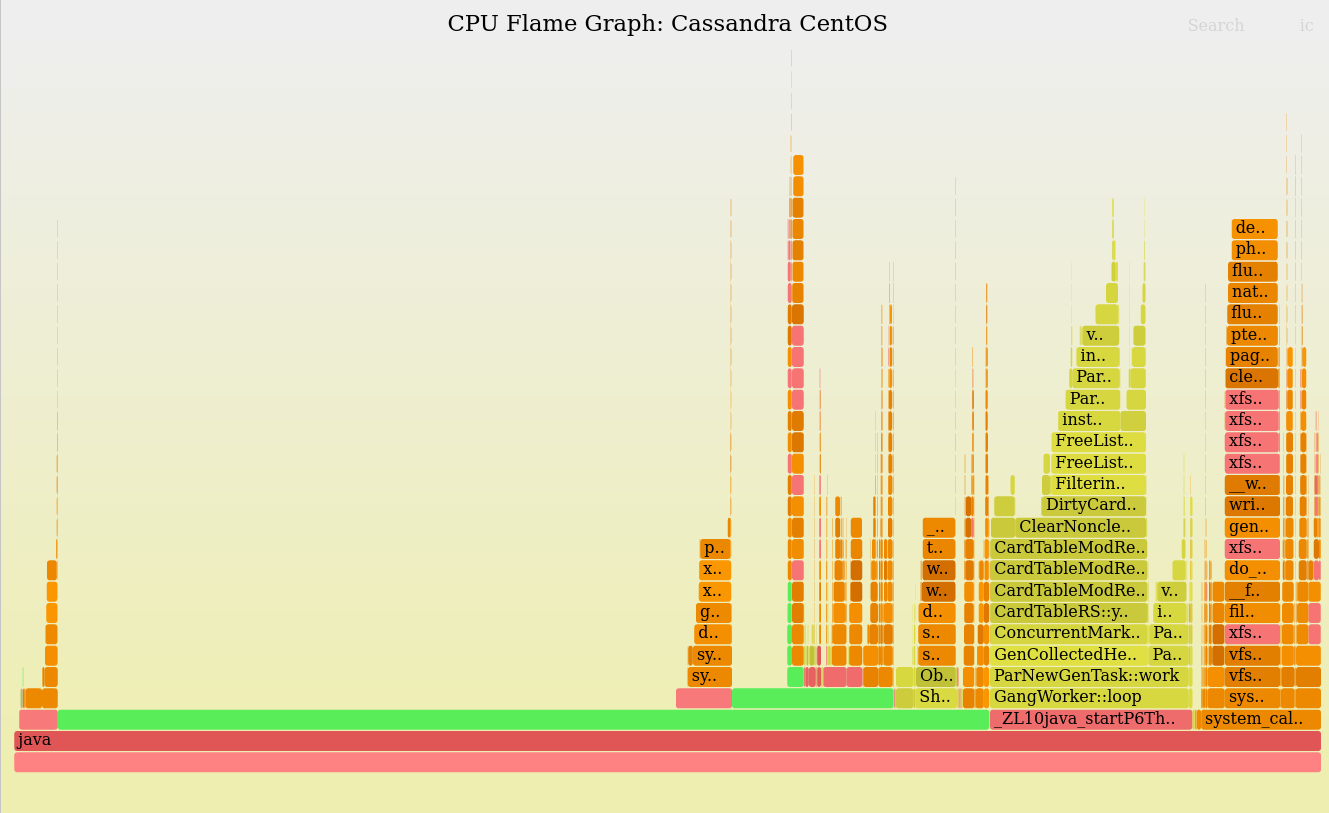
Understanding a CPU time should be easy by comparing CPU flame graphs. Since instances of both CentOS and Ubuntu were running in parallel, I could collect flame graphs at the same time (same time-of-day traffic mix) and compare them side by side.
The CentOS flame graph:

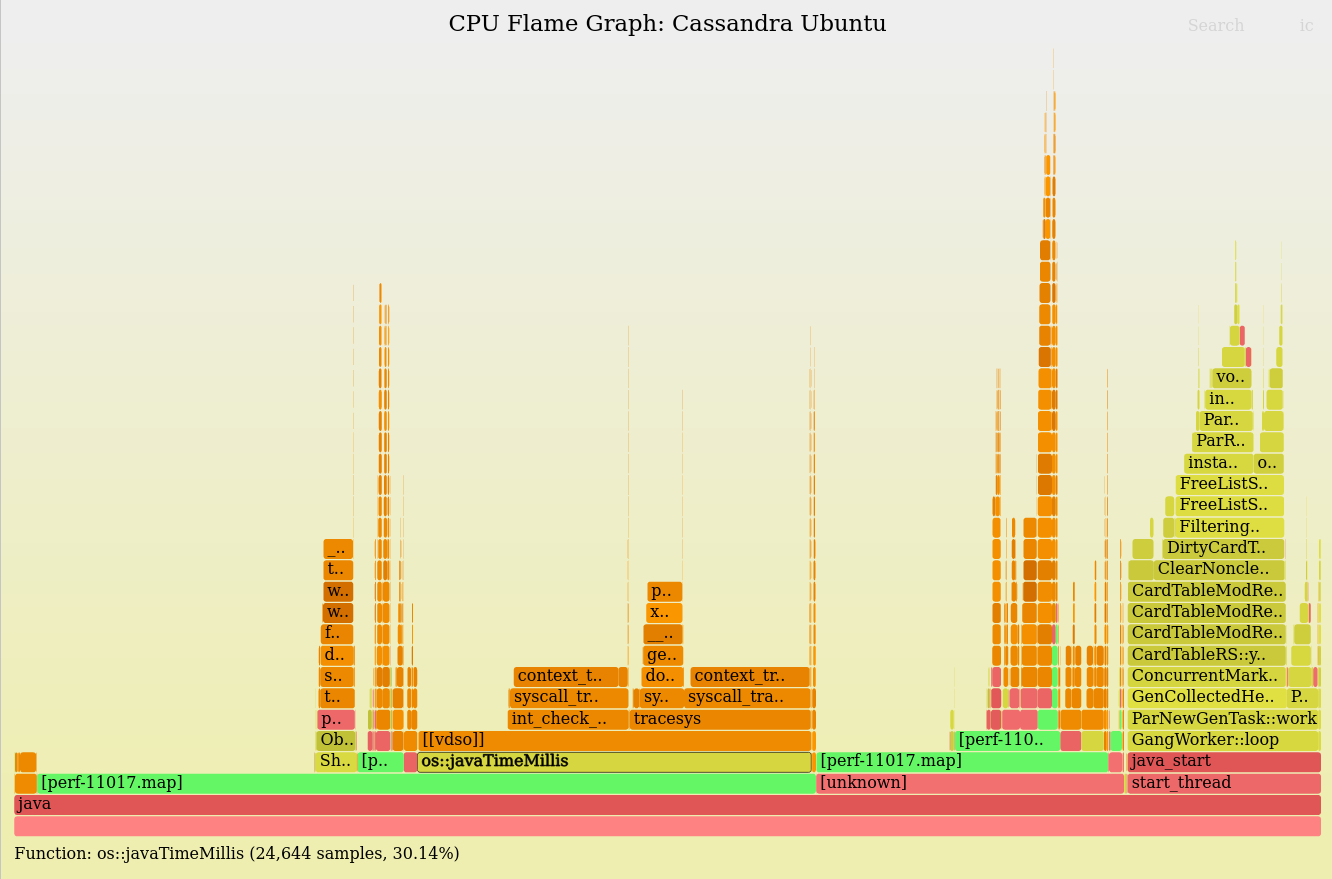
The Ubuntu flame graph:

Darn, they didn't work. There's no Java stack—there should be a tower of green Java methods—instead there's only a single green frame or two. This is how Java flame graphs looked at the time. Later that year I prototyped the c2 frame pointer fix that became -XX:+PreserveFramePointer, which fixes Java stacks in these profiles.
Even with the broken Java stacks, I noticed a big difference: On Ubuntu, there's a massive amount of CPU time in a libjvm call: os::javaTimeMillis(). 30.14% in the middle of the flame graph. Searching shows it was elsewhere as well for a total of 32.1%. This server is spending about a third of its CPU cycles just checking the time!
This was a weird problem to think about: Time itself had now become a resource and target of performance analysis.
The broken Java stacks turned out to be beneficial: They helped group together the os::javaTimeMillis() calls which otherwise might have have been scattered on top of different Java code paths, appearing as thin stacks everywhere. If that were the case, I'd have zoomed in to see what they were then zoomed out and searched for them for the cumulative percent; or flipped the merge order so it's an icicle graph, merging leaf to root. But in this case I didn't have to do anything as it was mostly merged by accident. (This is one of the motivating reasons for switching to a d3 version of flame graphs, as I want the interactivity of d3 to do things like collapse all the Java frames, all the user-mode frames, etc., to expose different groupings like this.)
3. Studying the flame graph
os::javaTimeMillis fetches the current time. Browsing the flame graph shows it is calling the gettimeofday(2) syscall which enters the tracesys() and syscall_trace_enter/exit() kernel functions. This gave me two theories: A) Some syscall tracing is enabled in Ubuntu (auditing? apparmor?). B) Fetching time was somehow slower on Ubuntu, which could be a library change or a kernel/clocksource change.
Theory (A) is most likely based on the frame widths in the flame graph. But I'm not completely sure. As a Xen guest, this profile was gathered using perf(1) and the kernel's software cpu-clock soft interrupts, not the hardware NMI. Without NMI, some kernel code paths (interrupts disabled) can't be profiled. Also, since it's a Xen guest, hypervisor time can never be profiled. These two factors mean that there can be missing kernel and hypervisor time in the flame graph, so the true breakdown of time in os::javaTimeMillis may be a little different.
Note that Ubuntu also has a frame to show entry into vDSO (virtual dynamic shared object). This is a user-mode syscall accelerator, and gettimeofday(2) is a classic use case that is cited in the vdso(7) man page. At the time, the Xen pvclock source didn't support vDSO, so you can see the syscall code above the vdso frame. It's the same on CentOS, although it doesn't include a vdso frame in the flame graph (I'd guess due to a perf(1) difference alone).
4. Colleagues/Internet
I love using Linux performance tools. But I also love solving issues quickly, and sometimes that means just asking colleagues or searching the Internet. I'm including this step as a reminder for anyone following this kind of analysis.
Others I asked hadn't hit this issue, and the Internet at the time had nothing using the search terms os::javaTimeMillis, clocksource, tracesys(), Ubuntu, EC2, Xen, etc. (That changed by the end of the year.)
5. Experimentation
To further analyze this with observability tools, I could:
- Fix the Java stacks to see if there's a difference in how time is used on Ubuntu. Maybe Java is calling it more often for some reason.
- Trace the gettimeofday() and related syscall paths, to see if there's some difference there: E.g., errors.
But as I summarized in my What is Observability post, the term observability can be a reminder not to get stuck on that one type of analysis. Here's some experimental approaches I could also explore:
- Disable tracesys/syscall_trace.
- Microbenchmark os::javaTimeMillis() on both systems.
- Try changing the kernel clocksource.
As (C) looked like a kernel rebuild, I started with (D) and (E).
6. Measuring the speed of time
Is there already a microbenchmark for os::javaTimeMillis()? This would help confirm that these calls really were slower on Ubuntu.
I couldn't find such a microbenchmark so I wrote something simple. I'm not going to try to make before and after time calls to time the duration in time (which I guess would work if you factored in the extra time in the timing calls). Instead, I'm just going to call time millions of times in a loop and time how long it takes (sorry, that's two many different usages of the word "time" in one paragraph):
$ cat TimeBench.java
public class TimeBench {
    public static void main(String[] args) {
        for (int i = 0; i < 100 * 1000 * 1000; i++) {
            long t0 = System.currentTimeMillis();
            if (t0 == 87362) {
                System.out.println("Bingo");
            }
        }
    }
}
This does 100 million calls of currentTimeMillis(). I then executed it via the shell time(1) command to give an overall runtime for those 100 million calls. (There's also a test and println() in the loop to, hopefully, convince the compiler not to optimize-out an otherwise empty loop. This will slow this test a little.)
Trying it out:
centos$ time java TimeBench
real    0m12.989s
user    0m3.368s
sys 0m18.561s

ubuntu# time java TimeBench
real    1m8.300s
user    0m38.337s
sys 0m29.875s
How long is each time call? Assuming the loop is dominated by the time call, it works out to be about 0.13 us on Centos and 0.68 us on Ubuntu. Ubuntu is 5x slower. As I'm interested in the relative comparison I can just compare the total runtimes (the "real" time) for the same result.
I also rewrote this in C and called gettimeofday(2) directly:
$ cat gettimeofdaybench.c
#include <sys/time.h>

int
main(int argc, char *argv[])
{
    int i, ret;
    struct timeval tv;
    struct timezone tz;

    for (i = 0; i < 100 * 1000 * 1000; i++) {
        ret = gettimeofday(&tv, &tz);
    }

    return (0);
}
I compiled this with -O0 to avoid dropping the loop. Running this on the two systems saw similar results.
I love short benchmarks like this as I can disassemble the resulting binary and ensure that the compiled instructions match my expectations, and the compiler hasen't messed with it.
7. clocksource Experimentation
My second experiment was to change the clocksource. Checking those available:
$ cat /sys/devices/system/clocksource/clocksource0/available_clocksource
xen tsc hpet acpi_pm
$ cat /sys/devices/system/clocksource/clocksource0/current_clocksource
xen
Ok, so it's defaulted to xen, which we saw in the flame graph (the tower ends with pvclock_clocksource_read()). Let's try tsc, which should be the fastest:
# echo tsc > /sys/devices/system/clocksource/clocksource0/current_clocksource
$ cat /sys/devices/system/clocksource/clocksource0/current_clocksource
tsc
$ time java TimeBench
real    0m3.370s
user    0m3.353s
sys     0m0.026s
The change is immediate, and my Java microbenchmark is now running over 20x faster than before! (And nearly 4x faster than on CentOS.) Now that it's reaching 33 ns, the loop instructions are likely inflating this result. If I wanted more accuracy, I'd partially unroll the loop so that the loop instructions become negligible.
8. Workaround
The time stamp counter (TSC) clocksource is fast as it retrieves time using just an RDTSC instruction, and with vDSO it can do this without the syscall. TSC traditionally was not the default because of concerns about time drift. Software-based clocksources could fix those issues and provide accurate monotonically-increasing time.
I happened to be speaking at a technical confering while still debugging this, and mentioned what I was working on to a processor engineer. He said that tsc had been stable for years, and any advise about avoiding it was old. I asked if he knew of a public reference saying so, but he didn't.
That chance encounter, coupled with the Netflix's fault-tolerant cloud, gave me enough confidence to suggest trying tsc in production as a workaround for the issue.
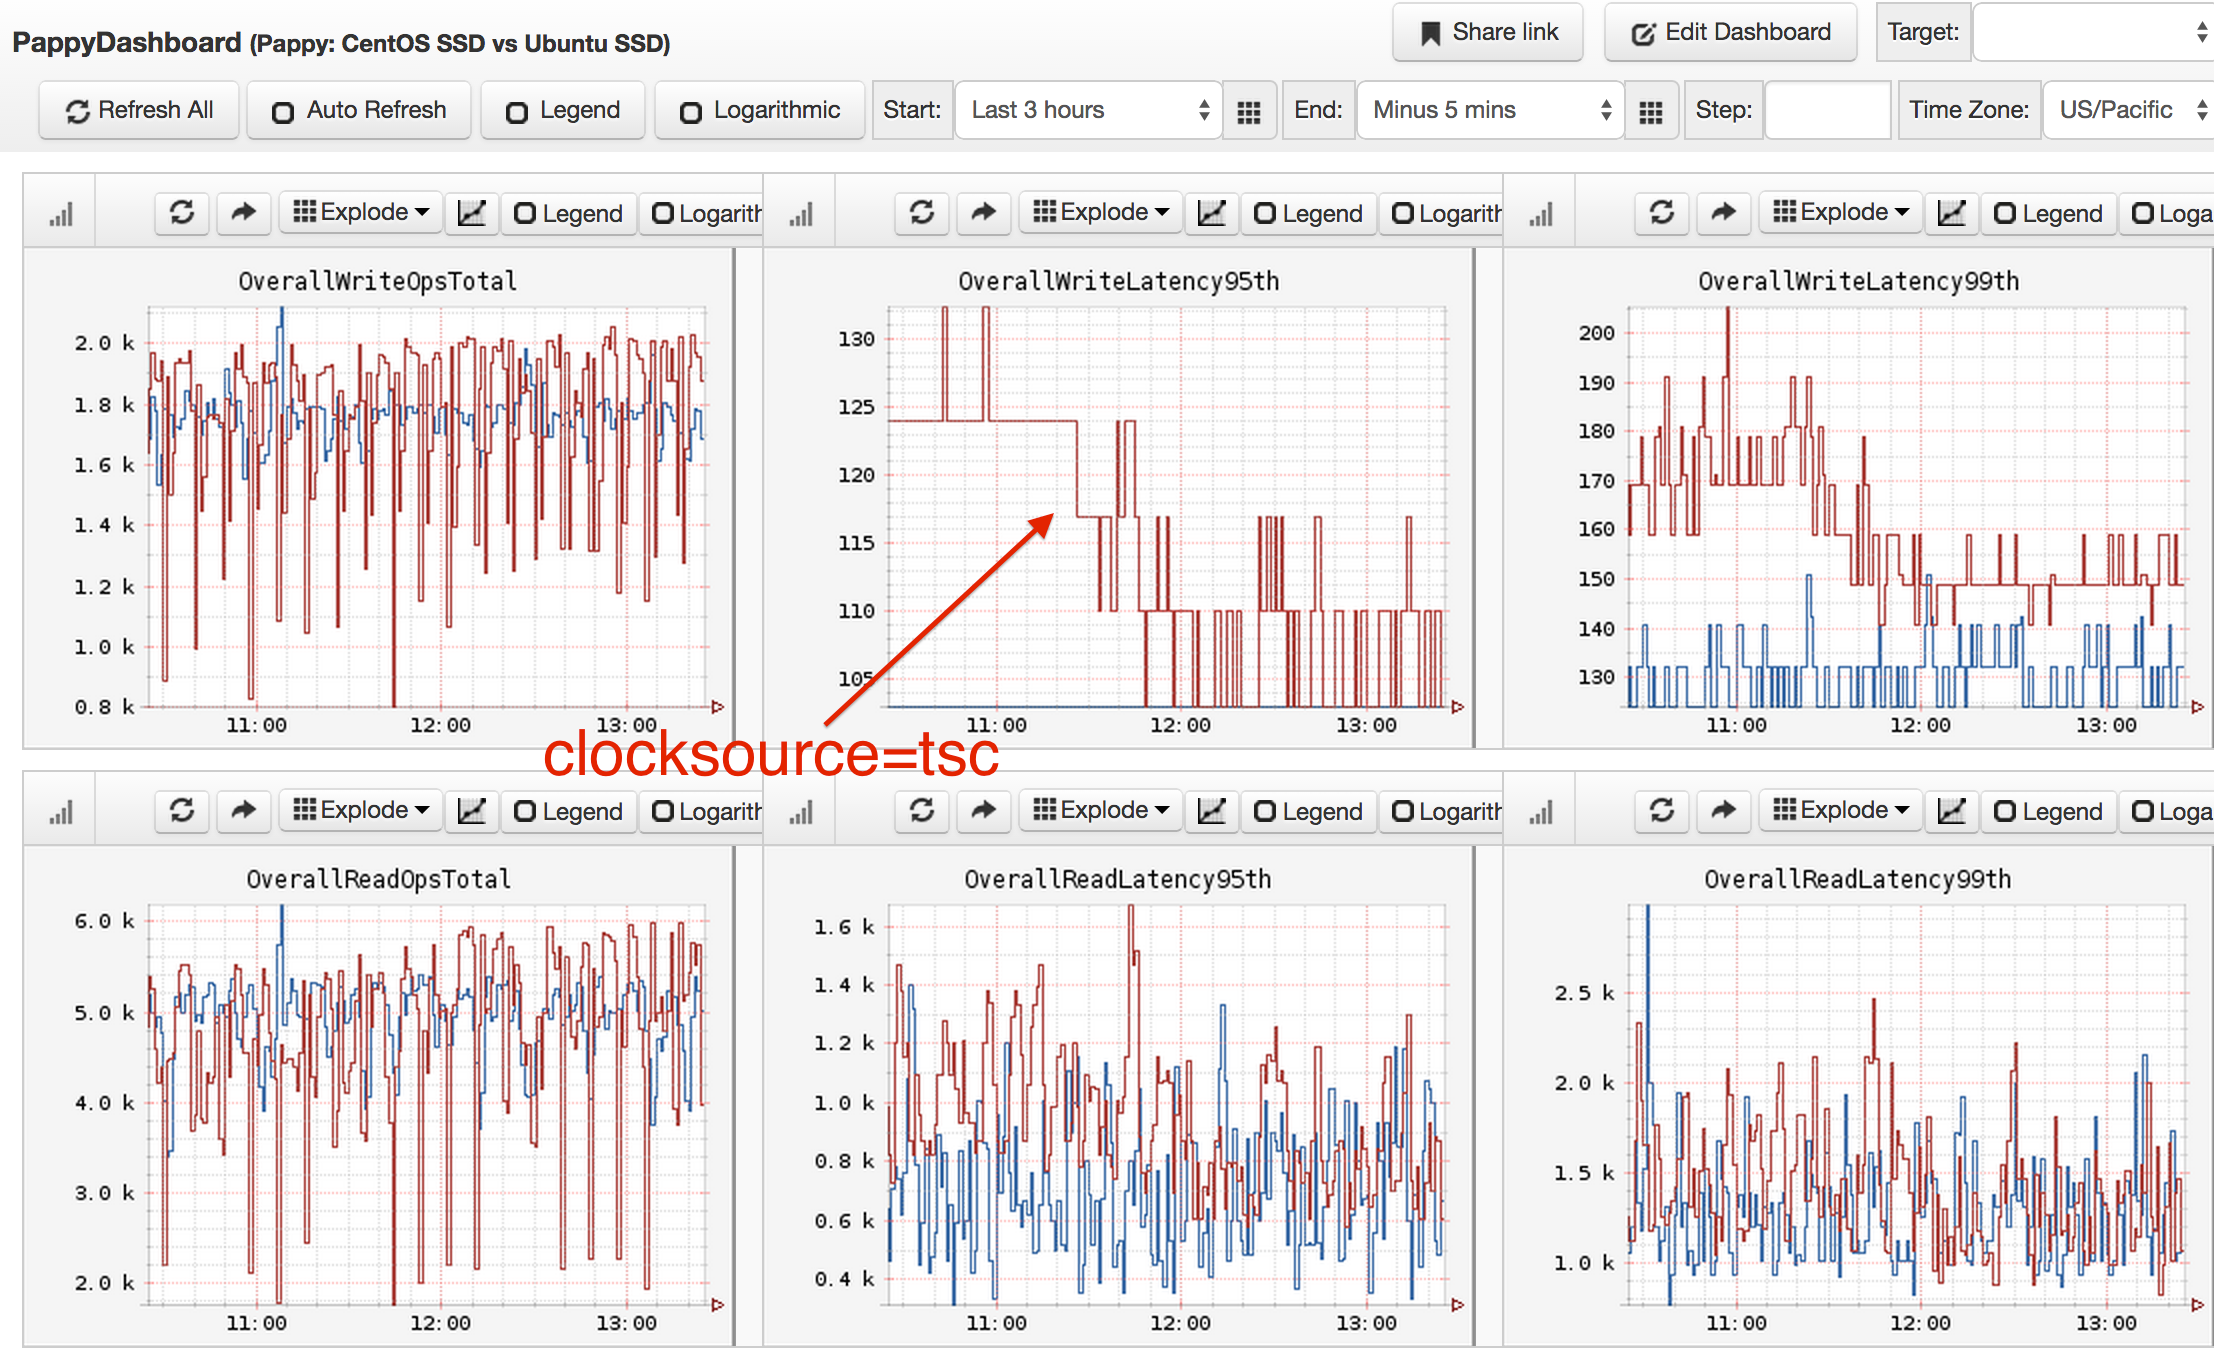
The change was obvious in the production graphs, showing a drop in write latencies:

Once tested more broadly, it showed the write latencies dropped by 43%, delivering slightly better performance than on CentOS.
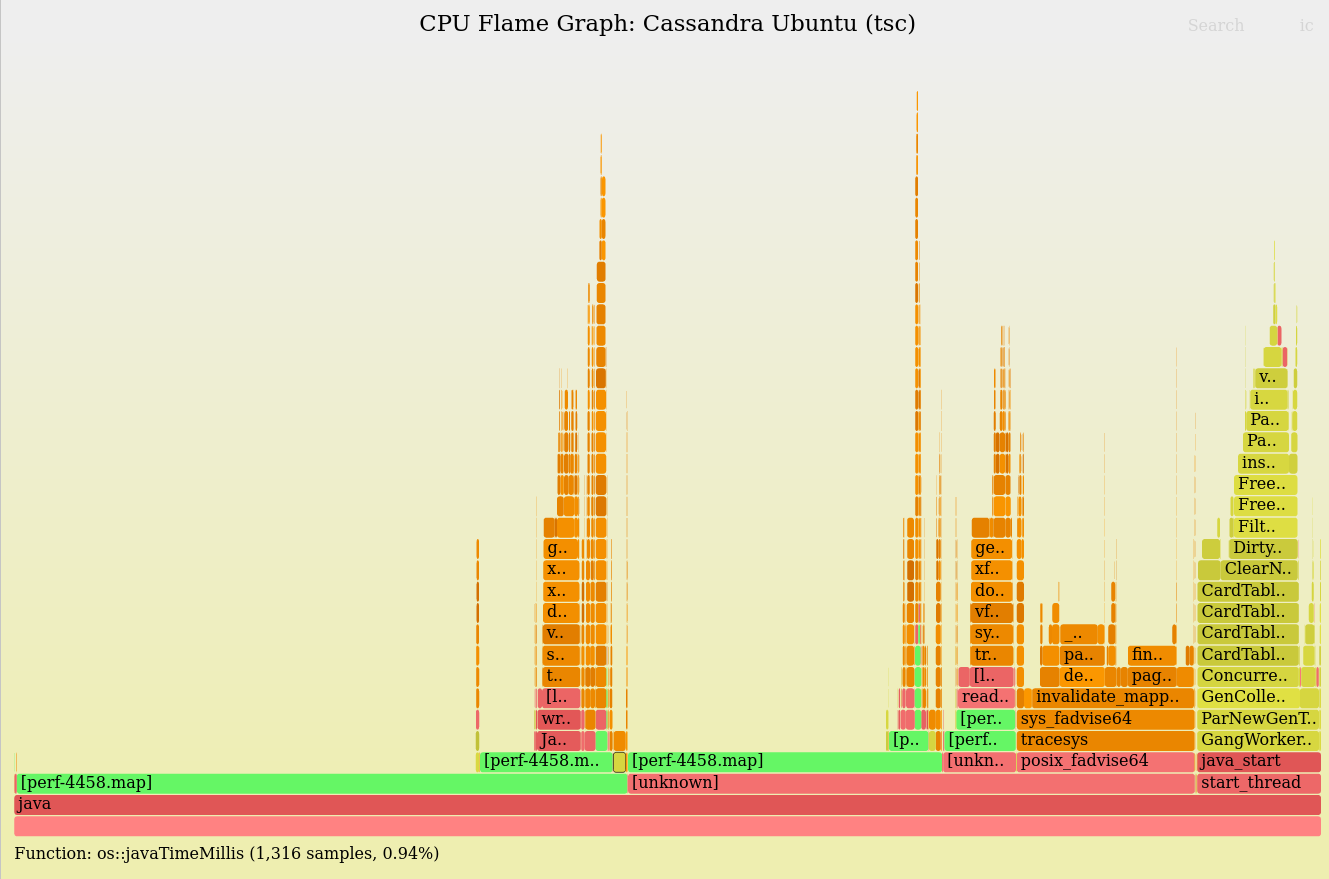
The CPU flame graph for Ubuntu now looked like:

os::javaTimeMillis() was now 1.6% in total. Note that it now enters "[[vdso]]" and nothing more: No kernel calls above it.
9. Aftermath
I provided details to AWS and Canonical, and then moved onto the other performance issues as part of the migration. A colleague, Mike Huang, also hit this for a different service at Netflix and enabled tsc. We ended up setting it in the BaseAMI for all cloud services.
Later that year (2014), Anthony Liguori from AWS gave a re:Invent talk recommending users switch the clocksource to tsc to improve performance. I also shared setting the clocksource in my talks and in my 2015 Linux tunables post. Over the years, more and more articles have been published about clocksource in virtual machines, and it's now a well-known issue. Amazon even provides an official recommendation (2021):
"For EC2 instances launched on the AWS Xen Hypervisor, it's a best practice to use the tsc clock source. Other EC2 instance types, such as C5 or M5, use the AWS Nitro Hypervisor. The recommended clock source for the AWS Nitro Hypervisor is kvm-clock."
As this indicates, things have changed with Nitro where clocksources are much faster (thanks!). In 2019 myself and others tested kvm-clock and found it was only about 20% slower than tsc. That's much better than the xen clocksource, but still slow enough to resist switching over absent a reason (such as an reemergence of tsc clock drift issues). I'm not sure if Intel ever published something to clarify tsc stability on newer processors. If you know they did, please drop a comment.
The JMH benchmark suite can also now test System.currentTimeMillis(), so it's no longer necessary to roll your own (unless you want to dissassemble it, in which case it's easier to have something short and simple).
As for tracesys: I investigated the overhead for other syscalls and found it to be negligible, and before I returned to work on it further the kernel code paths changed and it was no longer present in the stacks. Did that Ubuntu release have a misconfiguration of auditing that was later fixed? I like to get to the rock bottom of issues, so it was a bit unsatisfying that the problem went away before I did. Even if I did figure it out, we'd still have preferred to go with tsc instead of the xen clocksource for the 4x improvement.
10. Summary
Reading time itself can become a bottleneck for some clocksources. This was much worse many years ago on Xen virtual machine guests. For Linux I've been recommending the faster tsc clocksource for years, altough I'm not a processor vendor so I can't make assurances about tsc issues of clock drift. At least AWS have now included it in their recommendations.
Also, while I often post about superpower tracing tools, sometimes some humble hacking is best. In this case it was a couple of ad hoc microbenchmarks, only several lines of code each. Any time you're investigating performance of some small discrete system component, consider finding or rolling your own microbenchmark to get more information on it experimentally. You have two hands: observation and experimentation.
如有侵权请联系:admin#unsafe.sh