
Data Science: The Cental Limit Theorem Explained
2024-3-11 03:0:3 Author: hackernoon.com(查看原文) 阅读量:17 收藏
2024-3-11 03:0:3 Author: hackernoon.com(查看原文) 阅读量:17 收藏
Too Long; Didn't Read
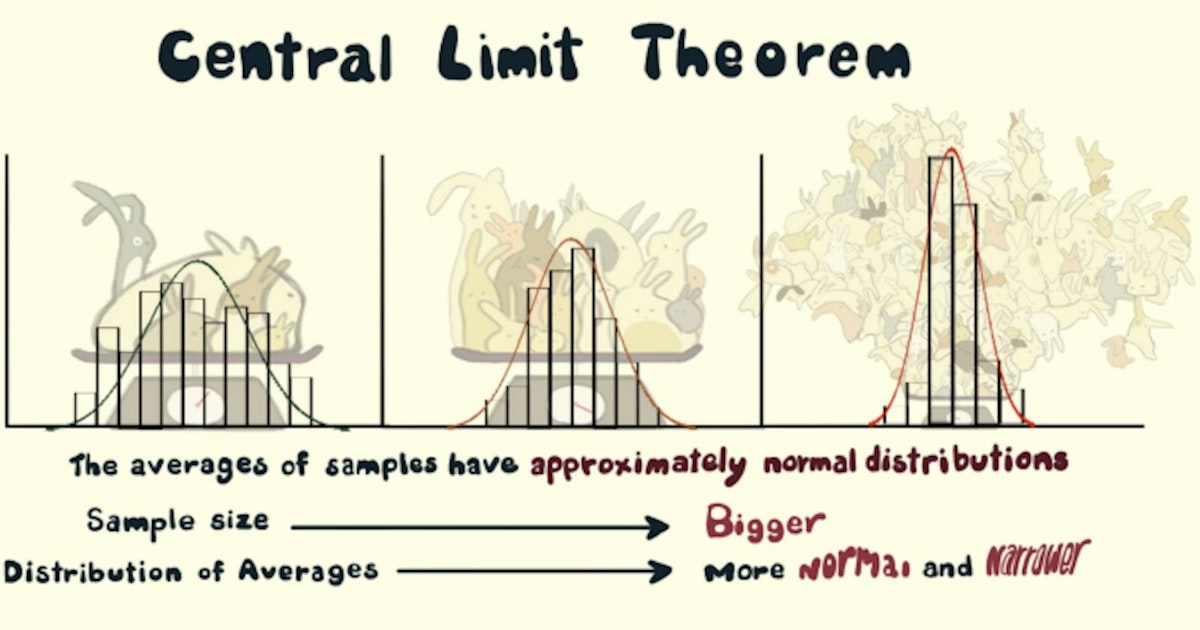
The Central Limit Theorem captures the following phenomenon: Take any distribution! (say a distribution of the number of passes in a football match) Start taking n samples from that distribution (say n = 5) multiple times [say m = 1000] times. Take the mean of each sample set (so we would have m = 1000 means) The distribution of means would be (more or less) normally distributed. (You will get that famous bell curve if you plot the means on the x-axis and their frequency on the y-axis.) Increase n to get a smaller standard deviation and increase m to get a better approximation to normal distribution.


RELATED STORIES


L O A D I N G
. . . comments & more!
文章来源: https://hackernoon.com/data-science-the-cental-limit-theorem-explained?source=rss
如有侵权请联系:admin#unsafe.sh
如有侵权请联系:admin#unsafe.sh