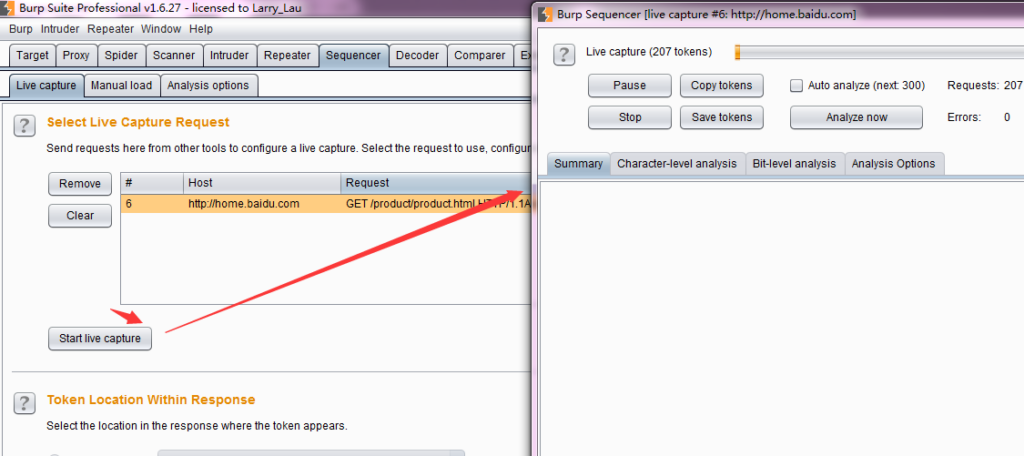
Burp Suite Sequencer is a tool used to detect the randomness quality of data samples. It is usually used to detect whether access tokens are predictable and whether password reset tokens are predictable. Through Sequencer’s data sample analysis, it can be easily This effectively reduces the risk of these critical data being falsified.

How to use Burp Suite Sequencer
As a random number analysis tool, Burp Sequencer may have unpredictable effects on the system during the analysis process. If you are not very familiar with the system, it is recommended not to perform data analysis in a production environment.
The steps to use it are roughly as follows:
- First, confirm that Burp Suite is installed correctly, and configure the browser proxy to run normally.
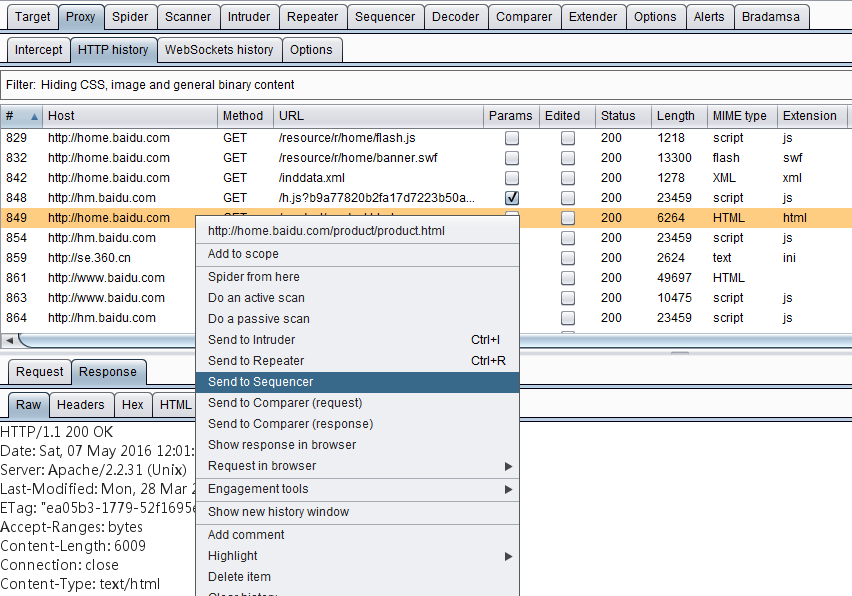
- From the historical log records of Burp Proxy, look for token or similar parameters, return to right-click to pop up the context menu, and click [Send to Sequencer].
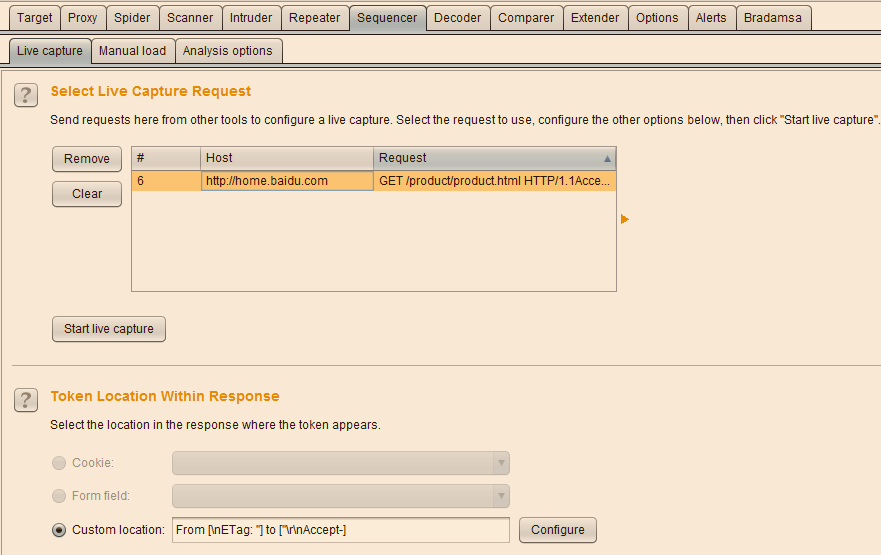
Enter the Live Capture panel of Burp Sequencer, select the record just sent, and click [Configure] to configure the token or parameters that need to be analyzed.
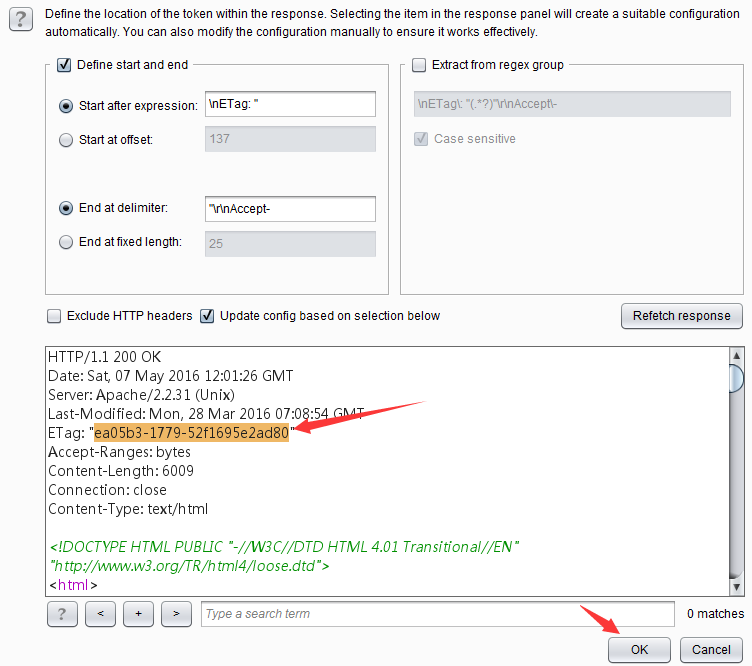
In the parameter configuration dialog box that pops up, select the parameter value and click the [OK] button to complete the parameter setting.
Click [Select Live Capture] to start obtaining parameter values.
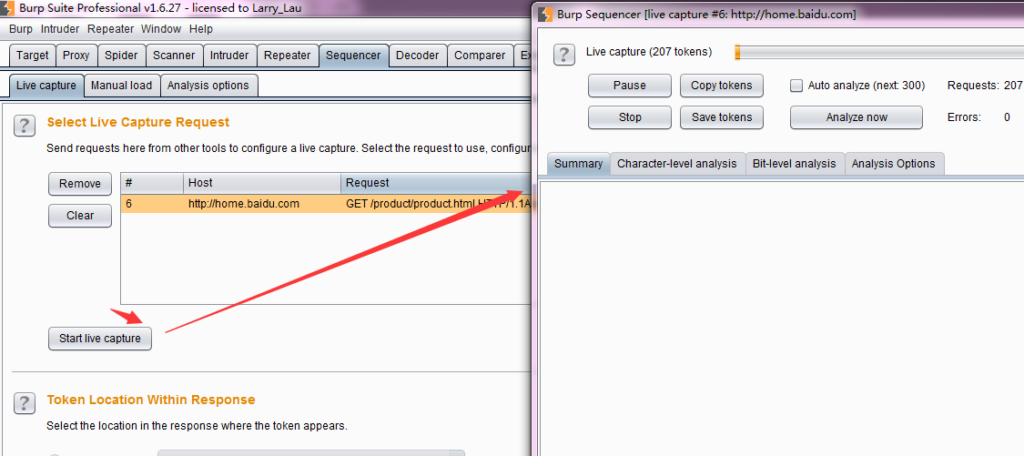
When the total number of captured parameter values is greater than 100, click [pause] or [stop] to perform data analysis. Click [Analyze now] to perform random analysis of the data.
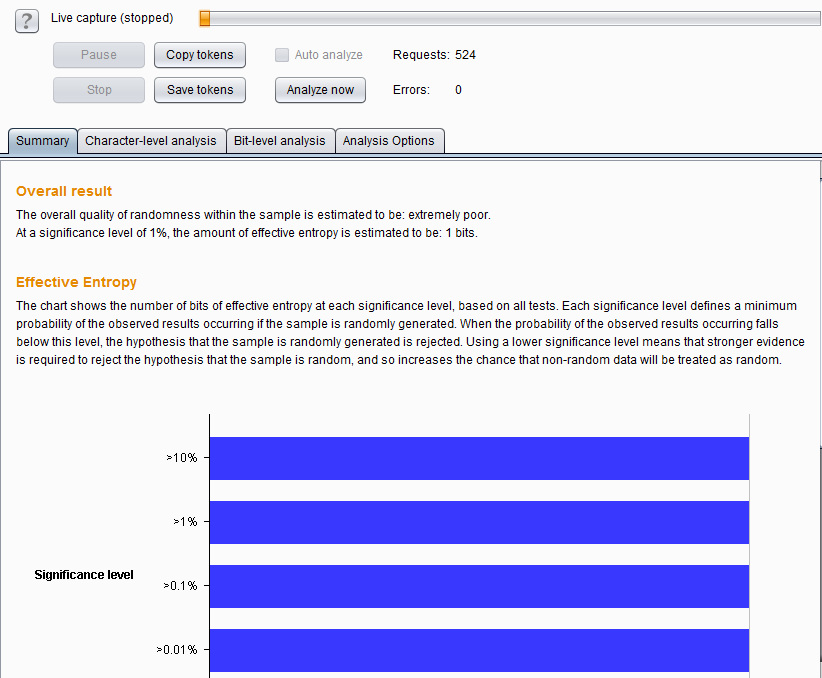
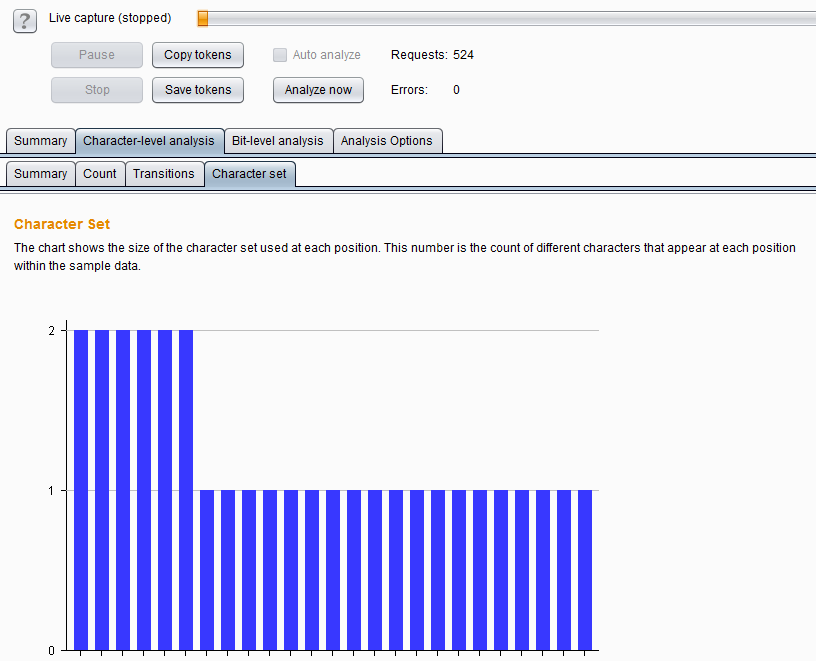
When the analysis is completed, you can see various charts of the analysis results.
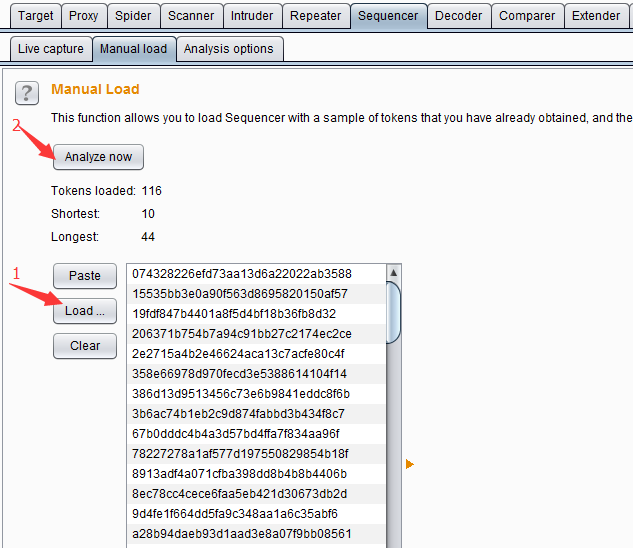
Of course, we can also save the obtained data and load parameters from the file for data analysis the next time it is used. Save the data as shown below.

When I use it again, I can directly load the data for analysis.
Burp Suite Sequencer Analysis Options
The purpose of setting the analysis options is mainly to control the token or parameters, what kind of processing needs to be done during the data analysis process, and what type of randomness analysis needs to be done. It mainly consists of two parts: Token Handling and Token Analysis .
Token Handling mainly controls how tokens are processed in data analysis. Its setting interface is as shown in the figure below:
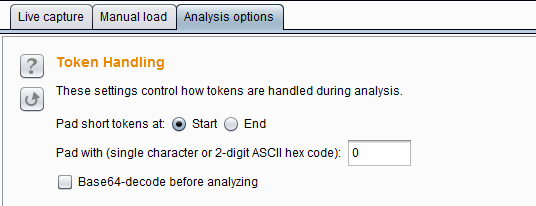
Pad short tokens at start/end means that if the tokens generated by the application have variable length, then These tokens need to be populated before data analysis to facilitate statistical testing.
You can choose whether to pad at the beginning or at the end of each token. In most cases, padding at the beginning is most appropriate. Pad with means you can specify the characters that will be used for padding. In most cases, numeric or ASCII hex-encoded tokens, padded with “0” are most appropriate. Base64-decode before analysis indicates whether to perform base64 decoding during data analysis. If the token uses base64 encoding, you need to check this option.
Token Analysis is mainly used to control the type of randomness analysis of data. We can select multiple analysis types, and can also enable or disable each character type-level and byte-level testing individually. Sometimes, it is useful to perform a preliminary analysis with all analysis types enabled before disabling certain analysis types in order to better understand the characteristics of the token, or to isolate any unusual properties exhibited by the sample. Its setting interface is as follows:
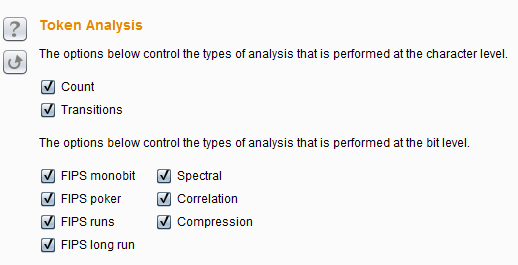
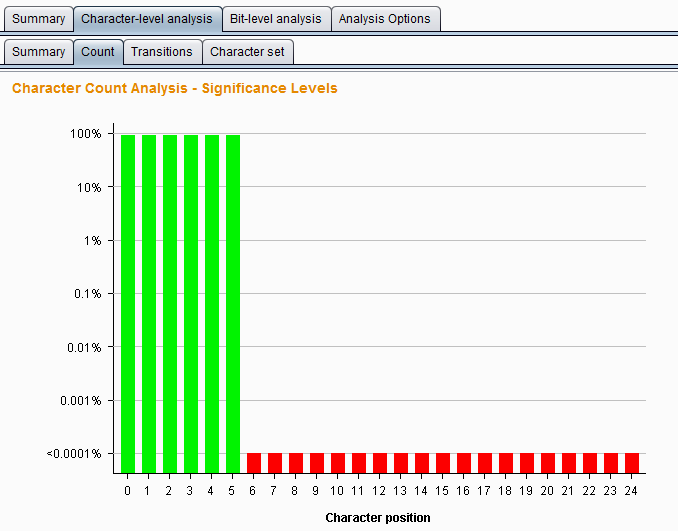
The above two options are character type levels that control data analysis, which include Count and Transitions . Count refers to analyzing the distribution of characters used at each position within the token. If it is a randomly generated sample, the distribution of characters used is likely to be roughly uniform.
Analyze the statistical probability at each position that the token is a randomly generated distribution. The analysis result chart is as follows:
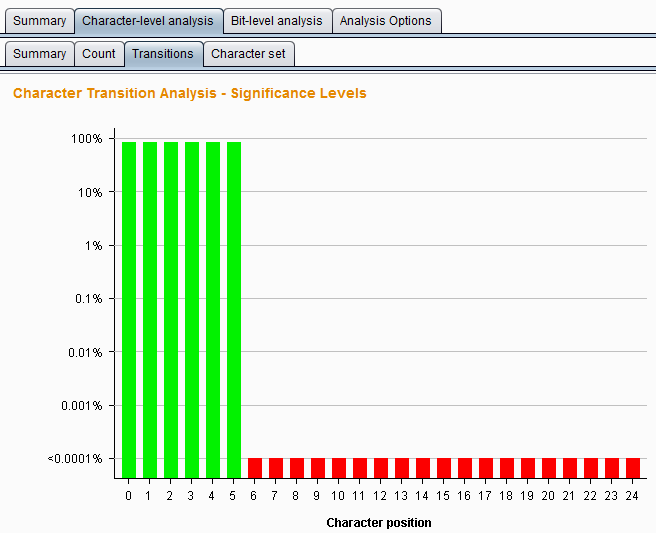
Transitions refer to changes between consecutive symbols in the analyzed sample data. If the sample is randomly generated, a character appearing at a given position is equally likely to be changed by the next token in any of the characters used at that position. Statistically analyze the probability of token random generation to change at each position. The analysis result chart is as follows:
The following settings are byte-level tests used to control data analysis, which are more powerful than character-level tests. With byte-level analysis enabled, each token is converted into a set of bytes, with the total number of bits determined by the size of the character set at each character position. It contains the following seven test types.
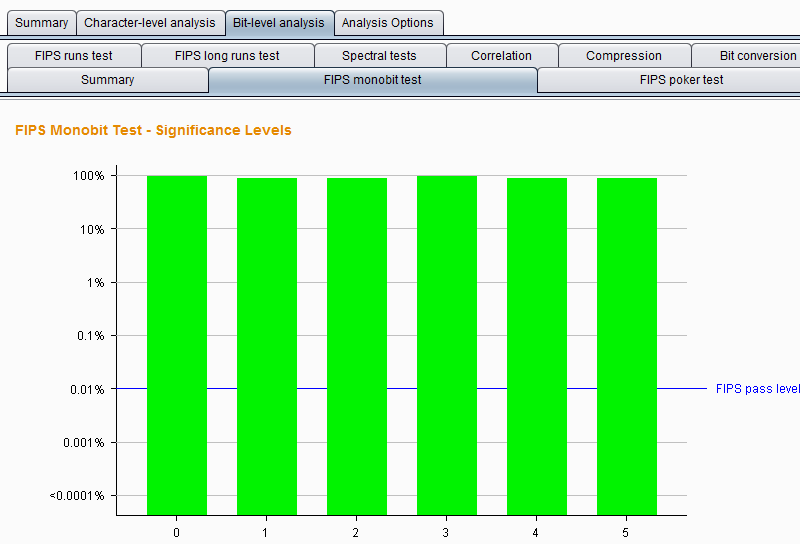
FIPS monobit test – It tests and analyzes the distribution of 0s and 1s at each bit position. If the sample is randomly generated, the number of 1s and 0s is likely to be approximately equal. The Burp Sequencer records whether each bit passed or failed the FIPS test observation. It is worth noting that the formal specification for FIPS testing assumes a total sample size of 20,000. If you want to obtain results that are as stringent as the FIPS specification, you should make sure to achieve a sample size of 20,000 tokens. The analysis result chart is as follows:
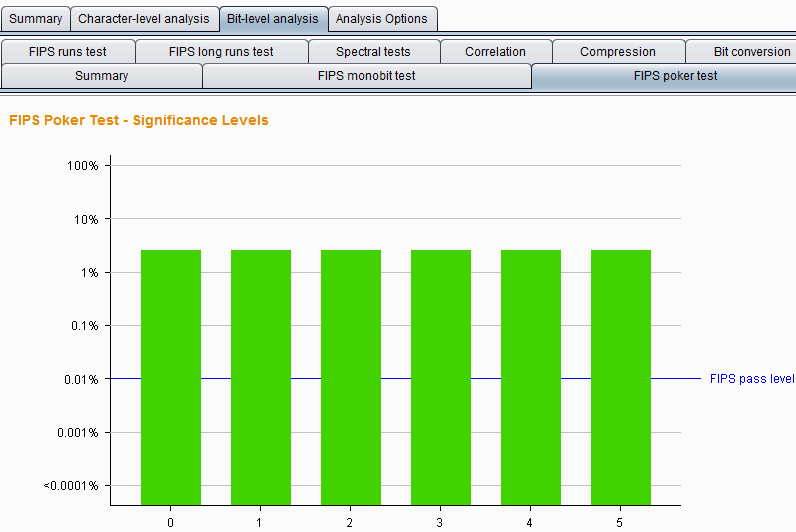
FIPS poker test – This test divides the j-bit sequence into four consecutive, non-overlapping groups, then derives 4 numbers, counts the number of times each number appears out of 16 possible digits, and uses the chi-square test to evaluate the numbers Distribution.
If the sample is generated randomly, the distribution of this number may be approximately uniform. At each position, through this testing method, analyze the probability that the token is a randomly generated distribution. The analysis result chart is as follows:
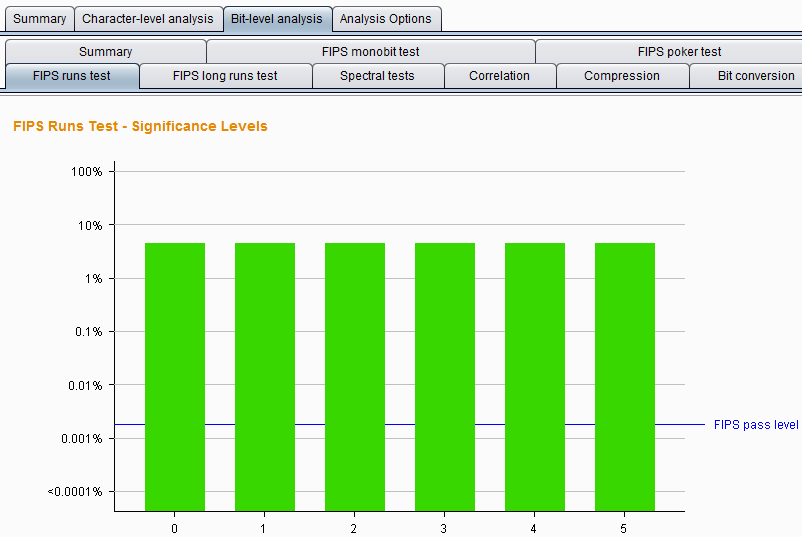
FIPS runs tests – This test divides a continuous sequence of bits with the same value into segments at each position, and then calculates the length of each segment as 1, 2, 3, 4, 5, and 6 and above. If the samples are randomly generated, then the length of these segments is likely to be within a range determined by the size of the sample set.
At each position, using this analysis method, observe the probability that the token is randomly generated. The analysis result chart is as follows:
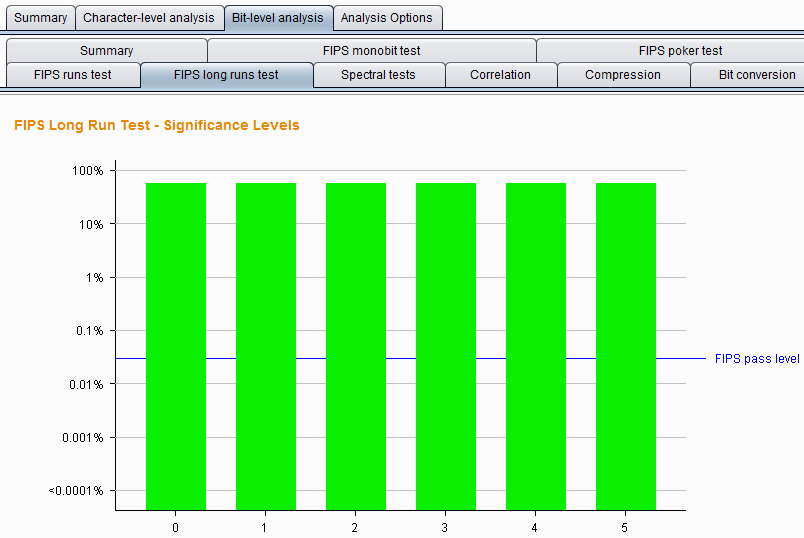
FIPS long runs test – This test divides a continuous sequence of bits with the same value into segments at each position and counts the longest segment. If the samples are randomly generated, the number of longest segments is likely to be within a range determined by the size of the sample set. At each position, using this analysis method, observe the probability that the token is the longest segment randomly generated. The analysis result chart is as follows:
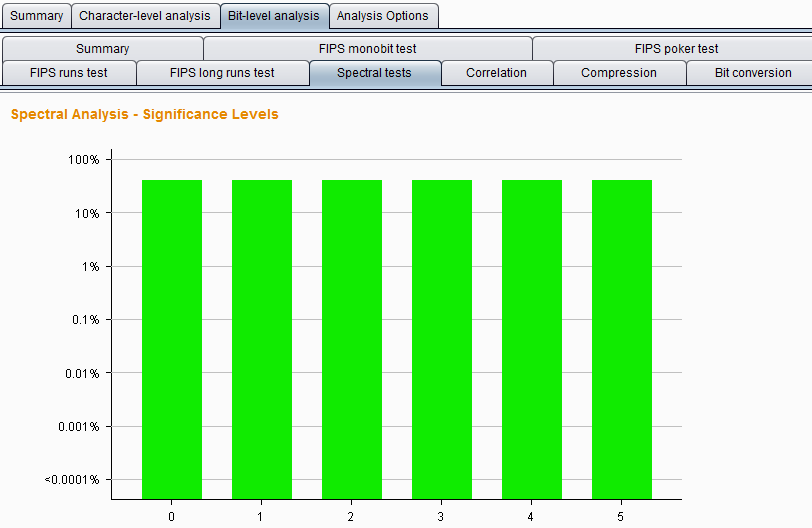
Spectral tests – These tests do a complex analysis at each position in the bit sequence and can identify evidence that certain samples are non-random by other statistical tests. The sample test passes through a sequence of bits and treats each series of consecutive numbers as coordinates in a multidimensional space and determines each position of a point in this space by plotting it on these coordinates. If the samples are randomly generated, the distribution of points in this space is likely to be roughly uniform; the appearance of clusters within this space indicates that the data are likely to be non-random. At each position, using this analysis method, observe the probability that the token occurs randomly. The analysis result chart is as follows:
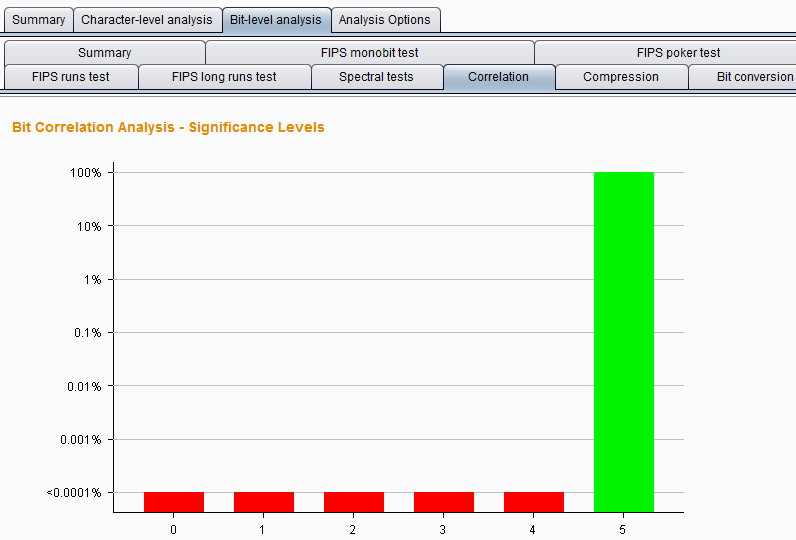
Correlation test – compares the entropy between a token sample with the same value in each position and a short token sample with a different value in each position to test for any correlation between the values in different bit positions inside the token Statistically significant relationship. If the sample is generated randomly, the value at a given bit position is equally likely to be accompanied by a one or a zero at any other bit position. At each position, use this analysis method to observe the probability that the token was randomly generated.
To prevent arbitrary results when a certain degree of correlation is observed between two bits, the test is adjusted so that its significance level is based on the significance level of the bits tested at the level of all other bits. The analysis result chart is as follows:
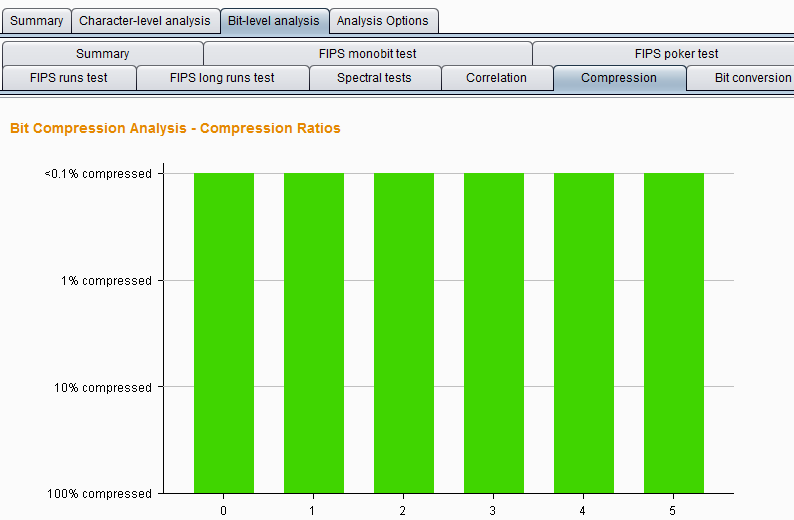
Compressoion test – This test does not use the statistical methods used in other tests, but counts the amount of entropy at each position in the bit sequence through a simple and intuitive indicator.
The analysis method attempts to compress each position of the bit sequence using standard ZLIB, and the results show that when it is compressed, the size of the bit sequence is reduced in proportion, and higher compression levels indicate that the data is less likely to be randomly generated. The analysis result chart is as follows:
Burp Suite Sequencer simple example
The most dangerous usage of Burp Suite Sequencer would likely be in the hands of malicious actors who are attempting to exploit vulnerabilities in web applications for nefarious purposes. While Burp Suite Sequencer itself is a legitimate security tool used by ethical hackers and security professionals to assess the randomness and quality of tokens, session identifiers, and other elements within web applications, it could be misused by attackers in several ways:
- Session Fixation Attacks: Malicious actors could use Burp Suite Sequencer to identify weaknesses in session identifiers generated by web applications. By exploiting predictable or weak session identifiers, attackers could potentially hijack user sessions, gaining unauthorized access to sensitive data or functionality.
- Cryptographic Weaknesses: Burp Suite Sequencer can help identify weaknesses in cryptographic algorithms used to generate tokens or encrypt sensitive data within web applications. Attackers could exploit these weaknesses to bypass security controls, decrypt confidential information, or launch cryptographic attacks such as chosen plaintext attacks or brute-force attacks.
- Authentication Bypass: If Burp Suite Sequencer reveals patterns or weaknesses in authentication tokens or mechanisms, attackers could leverage this information to bypass authentication controls and gain unauthorized access to restricted areas of web applications.
- Predictable CSRF Tokens: Cross-Site Request Forgery (CSRF) tokens are meant to prevent unauthorized actions initiated by malicious websites. If Burp Suite Sequencer identifies CSRF tokens that are predictable or easily guessable, attackers could craft malicious requests to perform actions on behalf of authenticated users without their consent.
- Data Tampering: By analyzing the randomness of tokens or parameters, attackers could identify opportunities to tamper with data exchanged between clients and servers, potentially leading to data manipulation, injection attacks, or other forms of exploitation.
It’s important to note that the danger lies not in the tool itself, but in how it’s used. Ethical hackers and security professionals use Burp Suite Sequencer to uncover vulnerabilities and strengthen the security of web applications. However, in the wrong hands, it could be used to exploit vulnerabilities for malicious purposes, posing significant risks to the confidentiality, integrity, and availability of web applications and their data. Therefore, it’s crucial for organizations to implement appropriate security measures and monitoring to detect and mitigate potential misuse of tools like Burp Suite Sequencer.
