2024-5-3 01:37:0 Author: binary.ninja(查看原文) 阅读量:6 收藏
A while ago, I was working on adding support for Windows kernel debugging in our debugger. It did not take me long to make the typical two-machine remote kernel debugging work since we already have code to leverage the DbgEng API. The only difference for starting a kernel debugging session is to call AttachKernel instead of CreateProcess2.
However, I was unable to quickly figure out how to start a local kernel debugging session. The documentation does not mention it! I tried to send a few different connection strings to AttachKernel, but had no luck.
There are multiple ways to deal with the issue, but I figured I should debug WinDbg and see how it actually starts a local kernel debugging session. And, of course, I chose to do so with Binary Ninja’s debugger.
Debugging Made Easy
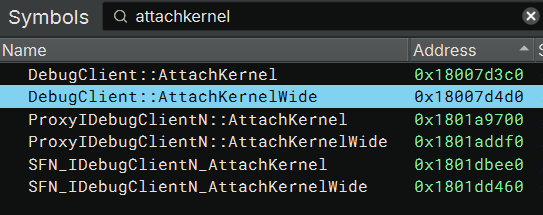
First, I loaded the dbgeng.dll from within the WinDbg installation into Binary Ninja. This is not the one from C:\Windows\System32: WinDbg always brings its own version of dbgeng.dll that is different from the system one. And, of course, Microsoft is generous enough to give us the PDB symbols for it, which I was able to use to quickly find the DebugClient::AttachKernelWide function (yes, WinDbg uses AttachKernelWide instead of AttachKernel):
I then navigated to the function and pressed F2 to add a breakpoint at its start:

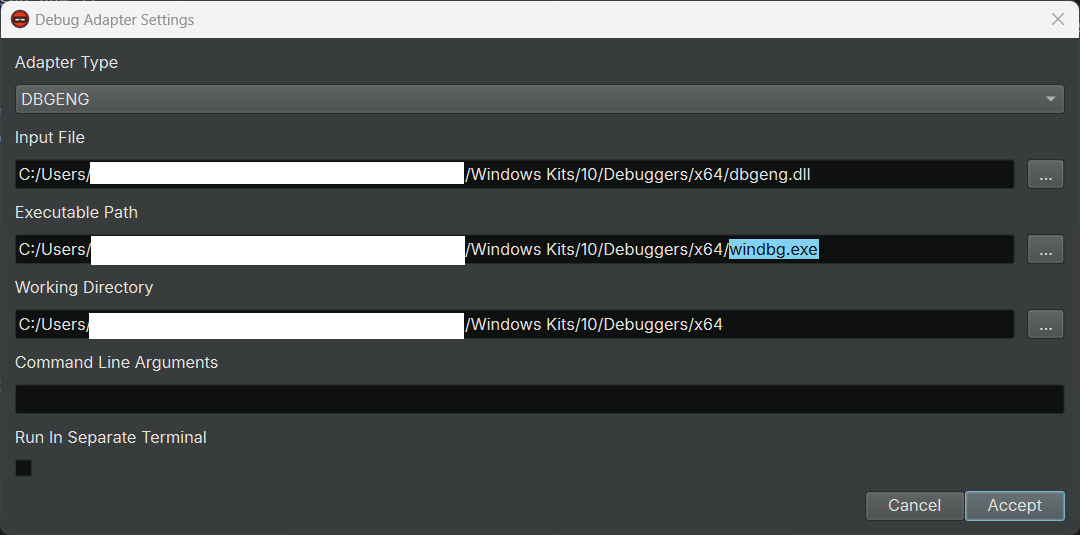
Since I opened dbgeng.dll, not windbg.exe, I needed to let the debugger know what the path of the windbg.exe executable is. So, I opened the Debug Adapter Settings dialog and set the Executable Path accordingly:
In case you don’t know how to open the Debug Adapter Settings dialog, there is a button for it at the top of the debugger sidebar:

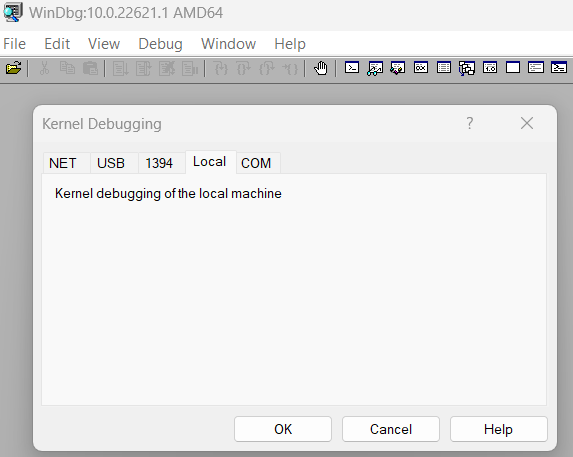
Now, I was ready to launch WinDbg! After clicking the launch button, the Binary Ninja debugger launched windbg.exe and broke at the entry point of dbgeng.dll, which is the _DllMainCRTStartup function. I resumed the process and the WinDbg UI popped up. I then tried to start a local kernel debugging session by clicking File -> Kernel Debug -> Local:
Then, the breakpoint at AttachKernelWide was hit. The type information from the PDB was:
long DebugClient::AttachKernelWide(class DebugClient* this, unsigned long arg2, uint16_t const* arg3)
Comparing this with the function prototype from the documentation:
HRESULT AttachKernelWide(
  [in]           ULONG  Flags,
  [in, optional] PCWSTR ConnectOptions
);
…we can see that arg2 is the Flags parameter and the arg3 is the ConnectOptions parameter. We also know from the x64 calling convention that the first four arguments are passed in the rcx, rdx, r8, and r9 registers. We can check the value of them in the debugger sidebar:
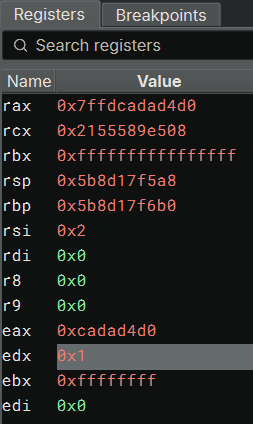
It turns out that Flags (rdx) has a value of 0x1 and ConnectOptions (r8) is just a nullptr. So, it seems the secret to start a local kernel debugging is to use a special flag (0x1) rather than a special connection string. No wonder I had no luck when I tried to figure out the special connection string!
I quickly updated my code to call AttachKernel in the very same way, and it worked! Interestingly, before I told my colleagues about it, I found there is actually a DEBUG_ATTACH_LOCAL_KERNEL macro in the DbgEng.h:
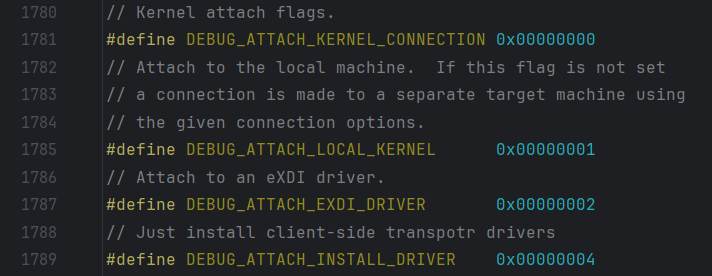
So, it turns out I could also have figured this out if I searched better! Anyway, the code I added to the debugger looks like this.
Try It Yourself!
If you want to try the new Window local kernel debugging feature yourself, you can either purchase a copy of Binary Ninja or download the new free version.
Next, you will need to configure your machine for local kernel debugging following this guide. (Basically: Run bcdedit /debug on and bcdedit /dbgsettings local with Administrator privileges, then reboot the computer.)
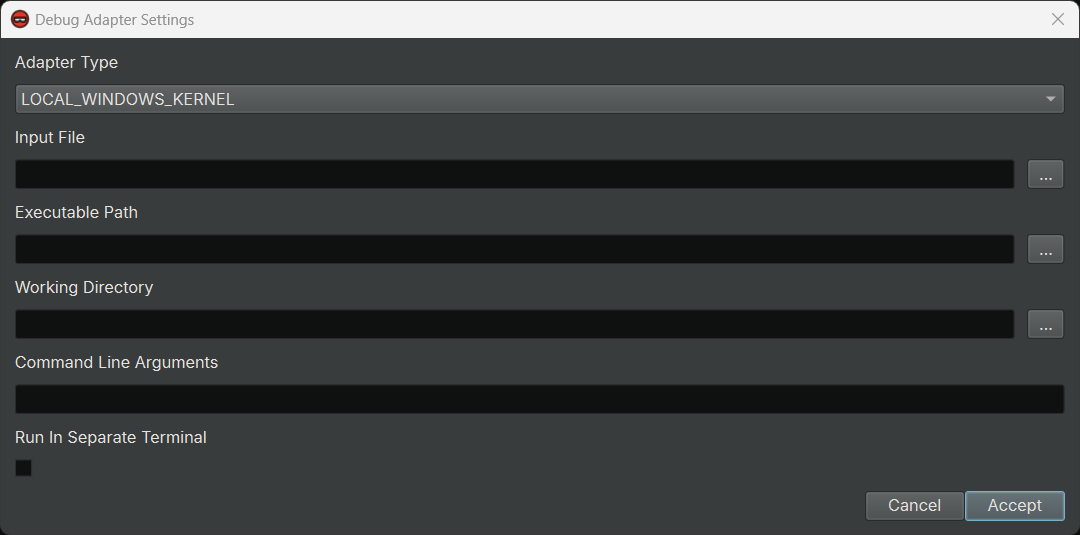
Our documentation for local kernel debugging can be found here. In short, you need to run Binary Ninja with Administrator privileges and then select LOCAL_WINDOWS_KERNEL as the adapter type:

如有侵权请联系:admin#unsafe.sh