2024-6-16 18:0:19 Author: hackernoon.com(查看原文) 阅读量:4 收藏
Table of Links
2 Related Works and 2.1 Deep Reinforcement Learning Algorithms
2.2 Deep Reinforcement Learning Libraries and 2.3 Deep Reinforcement Learning in Finance
3 The Proposed FinRL Framework and 3.1 Overview of FinRL Framework
3.5 Training-Testing-Trading Pipeline
4 Hands-on Tutorials and Benchmark Performance and 4.1 Backtesting Module
4.2 Baseline Strategies and Trading Metrics
4.5 Use Case II: Portfolio Allocation and 4.6 Use Case III: Cryptocurrencies Trading
5 Ecosystem of FinRL and Conclusions, and References
4.4 Use Case I: Stock Trading
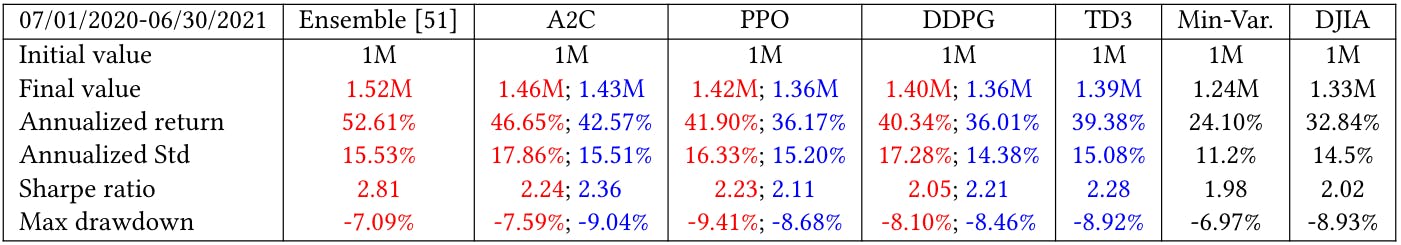
We use FinRL to reproduce both [50] and [51] for stock trading. The ensemble strategy [51] combines three DRL algorithms (PPO [42], A2C [32] and DDPG [26]) to improve the robustness.
The implementation is easy with FinRL. We choose three algorithms (PPO, A2C, DDPG) in the agent layer, and an environment with start and end dates in the environment layer. The implementations of DRL algorithms and data preprocessing are transparent to users, alleviating the programming and debugging workloads. Thus, FinRL greatly facilitates the strategy design, allowing users to focus on improving the trading performance.
Fig. 5 and Table 3 show the backtesting performance on Dow 30 constituent stocks, accessed at 2020/07/01. The training period
![Figure 5: Performance of stock trading [51] using the FinRL framework.](https://hackernoon.imgix.net/images/fWZa4tUiBGemnqQfBGgCPf9594N2-sl830vq.png?auto=format&fit=max&w=3840)
![Figure 6: Performance of portfolio allocation [21] using the FinRL framework.](https://hackernoon.imgix.net/images/fWZa4tUiBGemnqQfBGgCPf9594N2-0z930sm.png?auto=format&fit=max&w=3840)

is from 2009/01/01 to 2020/06/30 on a daily basis, and the testing period is from 2020/07/01 to 2021/06/30. The performance in terms of multiple metrics is consistent with the results reported in [51] and [50], and here we show results in a recent trading period. We can see from the DJIA index that the trading period is a bullish market with an annual return of 32.84%. The ensemble strategy achieves a Sharpe ratio of 2.81 and an annual return of 52.61%. It beats A2C with a Sharpe ratio of 2.24, PPO with a Sharpe ratio of 2.23, DDPG with a Sharpe ratio of 2.05, DJIA with a Sharpe ratio of 2.02, and min-variance portfolio allocation with a Sharpe ratio of 1.98, respectively. Therefore, the backtesting performance demonstrates that FinRL successfully reproduces the ensemble strategy [51].

如有侵权请联系:admin#unsafe.sh