2024-8-6 07:44:41 Author: hackernoon.com(查看原文) 阅读量:0 收藏
Authors:
(1) Tinghui Ouyang, National Institute of Informatics, Japan ([email protected]);
(2) Isao Echizen, National Institute of Informatics, Japan ([email protected]);
(3) Yoshiki Seo, Digital Architecture Research Center, National Institute of Advanced Industrial Science and Technology, Japan ([email protected]).
Table of Links
Description and Related Work of OOD Detection
Conclusions, Acknowledgement and References
IV. EXPERIMENTS AND RESULTS
In this paper, to evaluate the performance of the proposed method on OOD data detection, especially detecting abnormal data for AI quality assurance, two image benchmark datasets, such as MNIST [26] and CIFAR10 [27] datasets, and one industrial dataset are studied in this section. Moreover, considering OOD data are out of the studied problem domain, we can simply use an external dataset as outlier for evaluation experiment in this paper, e.g., CIFAR10 data can be anomalies out of the problem domain of MNIST data.
- Example 1: MNIST dataset
The MNIST dataset is a benchmark dataset consisting of images of hard-writing digital numbers from 0 to 9, it is widely used in deep learning studies. It contains 50,000 training images and 10,000 testing images, with a pixel resolution of 28*28. It is seen that the original data is high-dimensional and not very suitable for OOD detection directly. According to the proposed OOD detection framework in Section II, a deep AE with 5 layers is first constructed for feature learning on MNIST data and then trained on the given training dataset. For convenience, we can then extract the activation trace of the output of the encoder as the features in the OOD study since they have acceptable dimensionality and good representation ability to the original data. Subsequently, we can utilize the extracted features for the calculation of OOD scores via different statistical measurements defined in Section III. Based on the proposed LCP measurement, which is actually based on data reconstruction, so first we can show the distribution of reconstruction error by using LCP in data reconstruction, as shown in Fig. 3.
Fig. 3 plots reconstruction errors in 4 dimensions. It is seen that conditional probability distributions of reconstruction error match well with the Gaussian distribution, which satisfies our hypothesis in Section III.C. Therefore, it is verified feasible to use LCP measurement for OOD data description. Then,

we can calculate the reconstruction error via (10) for OOD data detection. In order to generate OOD data for evaluation, random noise and formatted CIFAR10 images are separately considered in the experiments. Results via ROC [28] curves are shown in Fig. 4.
To quantitatively analyze the above results, the following table calculates and presents the AUC values of ROC curves.

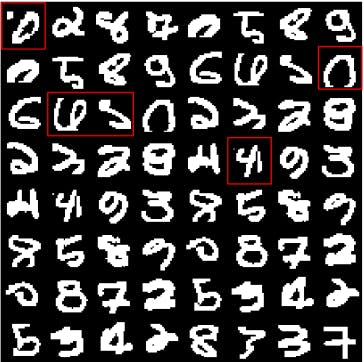
From results of Fig. 4 and Table I, we can see that, in comparison among conventional methods, kNN and KD perform better than LOF and MD. One possible reason for this is that MD requires strict Gaussian distribution on all data. In this paper’s experiments, we did not consider sub-pattern learning in MNIST data, so the latent features destroy this Gaussian assumption on all data. However, kNN and LCP can get rid of this global assumption since they use only local information. Moreover, since the proposed LCP inherits the advantages of both KD and kNN, it is found to outperform all other methods on noise and CIFAR10 outlier detection from the above results, demonstrating its effectiveness on OOD detection. Additionally, with the demonstration of LCP’s superiority in OOD detection, Fig. 5 shows some examples of MNIST data with high OOD scores using LCP measurement. These data with high OOD scores are assumed to be corner case data [29] with a high risk of wrong decision. For example, as seen in Fig. 5, some abnormal images with additional patterns,


incomplete shape, unsuitable rotation, or shape confusion are found. Therefore, it can further qualitatively demonstrate the ability of LCP measurement in OOD description.
2) Example 2: CIFAR10 dataset
Besides the MNIST dataset, CIFAR10 is also a benchmark dataset in deep learning study, which contains 10 classes of 3*32*32 images. Following the same implementation steps above, we first construct AE for feature learning, then use the learned features for OOD study. To generate OOD data for evaluation, random noise images and reformatted MNIST data are considered outliers in this experiment. Then, OOD detection performance based on the mentioned five statistical measurements is calculated and presented below. Based on the results of Table II, we can find the same conclusion that the proposed LCP measurement outperforms other metrics on both noise and MNIST outlier detection. Therefore, the feasibility and effectiveness of the LCP-based OOD detection method are further proved on the CIFAR10 dataset. Moreover, we can also utilize the OOD score via LCP measurement to show some corner case data, as below
From the given CIFAR10 images with high OOD scores, we can find that some images are cropped, e.g., images of cat, horse, and car highlighted with red frame in Fig. 6. Same to the incomplete images in the MNIST dataset, cropped CIFAR10 images have a loss of information compared with normal data, so they have a risk in training and testing. Through the proposed OOD detection method, it is possible for developers to clean these kinds of data for data quality assurance.
3) Example 3: German Traffic Sign Recognition Benchmark (GTSRB) dataset [30]
Furthermore, to study the generation ability of the proposed method, this paper proposes to use an industrial dataset for evaluation, e.g., the GTSRB dataset. This dataset contains 43 classes of traffic signs. By unifying the input images as the


size of 3*32*32 and feeding them to train an AE model for feature learning. Then, based on the proposed framework in Fig. 2, activation traces of the latent features in AE are used for the OOD study. Four traditional OOD methods based on KD, MD, kNN, and LOF are implemented along with the proposed LCP-based method. Numerical results on AUC-ROC are presented in Table III.
In Table III, outliers based on noise, MNIST data, and CIFAR10 data are implemented, respectively. Through the comparison among different OOD methods, the superiority of the proposed LCP-based method is again verified in the industrial dataset. Moreover, these methods seem to perform better in detecting MNIST outliers than the other two, and this is because MNIST data have more discriminative features compared with GTSRB data. Furthermore, by using the LCP-based data reconstruction error as the OOD data score, the possible outliers inside the original dataset are shown in Fig. 7. Among these GTSRB images with high OOD scores in Fig. 7, it is seen that there are some images with low brightness, blurred, or shielded with other objects, which might be the reasons leading to high OOD scores and lower data quality in AIQM.
如有侵权请联系:admin#unsafe.sh