2024-8-8 02:20:18 Author: hackernoon.com(查看原文) 阅读量:4 收藏
Table of Links
3 Dataset Overview, Preprocessing, and Features
3.1 Successful Companies Dataset and 3.2 Unsuccessful Companies Dataset
4 Model Training, Evaluation, and Portfolio Simulation and 4.1 Backtest
5 Other approaches
5.2 Founders ranking model and 5.3 Unicorn recommendation model
7 Further Research, References and Appendix
3.3 Features
The feature space of the model includes:
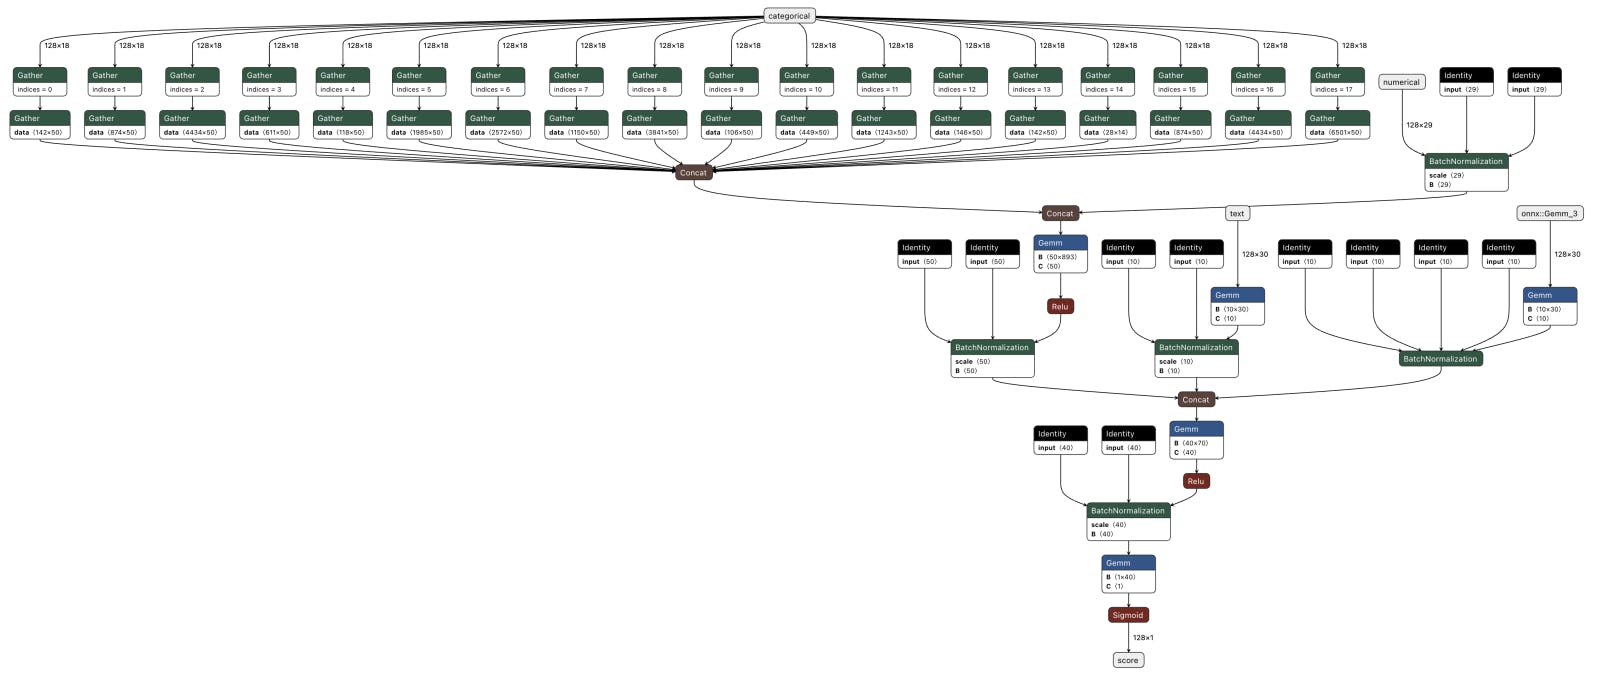
Founders Features Categorical: country_code, region, city, institution_name, degree_type, subject. Numerical: twitter_url, linkedin_url, facebook_url, gender, is_completed, num_degrees, num_last_startups, num_last_jobs, number_of_founders.
We incorporated three binary flags into our model to represent the presence of founders’ social media links. Since a company can have multiple founders, it was essential to aggregate information on all the founders for each company. For categorical variables, the most frequent value from the list was used, and the median for numerical variables.
Investors Features Categorical: type, country_code, region, city, investor_types. Numerical: investment_count, total_funding_usd, twitter_url, linkedin_url, facebook_url, raised_amount_usd, investor_count, num_full.

Functions that generate features based on the founders’ and investors’ data incorporate a date parameter as input. This approach is necessary to the model from using future information. For example, details about the number of companies founded or the founder’s previous job experience that took place after the date of interest should not be incorporated into the feature set to avoid information leakage from the future.
Rounds features Categorical: country_code, investment_type, region, city, investor_name. Numerical: sum, mean, max of raised_amount_usd, investor_count, post_money_valuation_usd.
It is crucial to emphasize that all features related to a company’s investment rounds are gathered at a time point prior to the beginning of the time window of interest.
Categories There are two additional types of text data - text tags representing the companies’ field of work. For example:
• category_list: Internet, Social Media, Social Network
• category_groups_list: Data and Analytics, Information Technology, Software
The set of tags used in our study consists of a list of keywords separated by commas. We used the NMF (Non-Negative Matrix Factorization) matrix factorization method to generate features from these tags. This process involves creating a binary table with companies represented as rows and tags as columns, where each value in the table indicates whether a given company is associated with a specific tag (1) or not (0). The trained matrix factorization then converts each binary vector into a smaller dimension vector (in our case, 30).
All categorical features are encoded using the OrdinalEncoder, while numerical features are normalized.
如有侵权请联系:admin#unsafe.sh