
The most widely used ProjectDiscovery tool, httpx, has been an essential asset in the arsenal of security professionals and researchers. Known for its ability to probe live hosts and capture crucial information.
httpx has long been a go-to solution for:
- Response data (status, server, location, etc.)
- Technology detection
- Extra metadata (favicon, hashes, response time, etc.)
- Screenshots
- Linked domain discovery (extracting domains from CSP, body)
- Cloud metadata (ASN, CDN, WAF information)
- And more
We're thrilled to announce that httpx (from v1.6.7) now has a dashboard with built-in asset management, available on the ProjectDiscovery Cloud Platform (PDCP). This feature has been one of the most requested since httpx's inception.
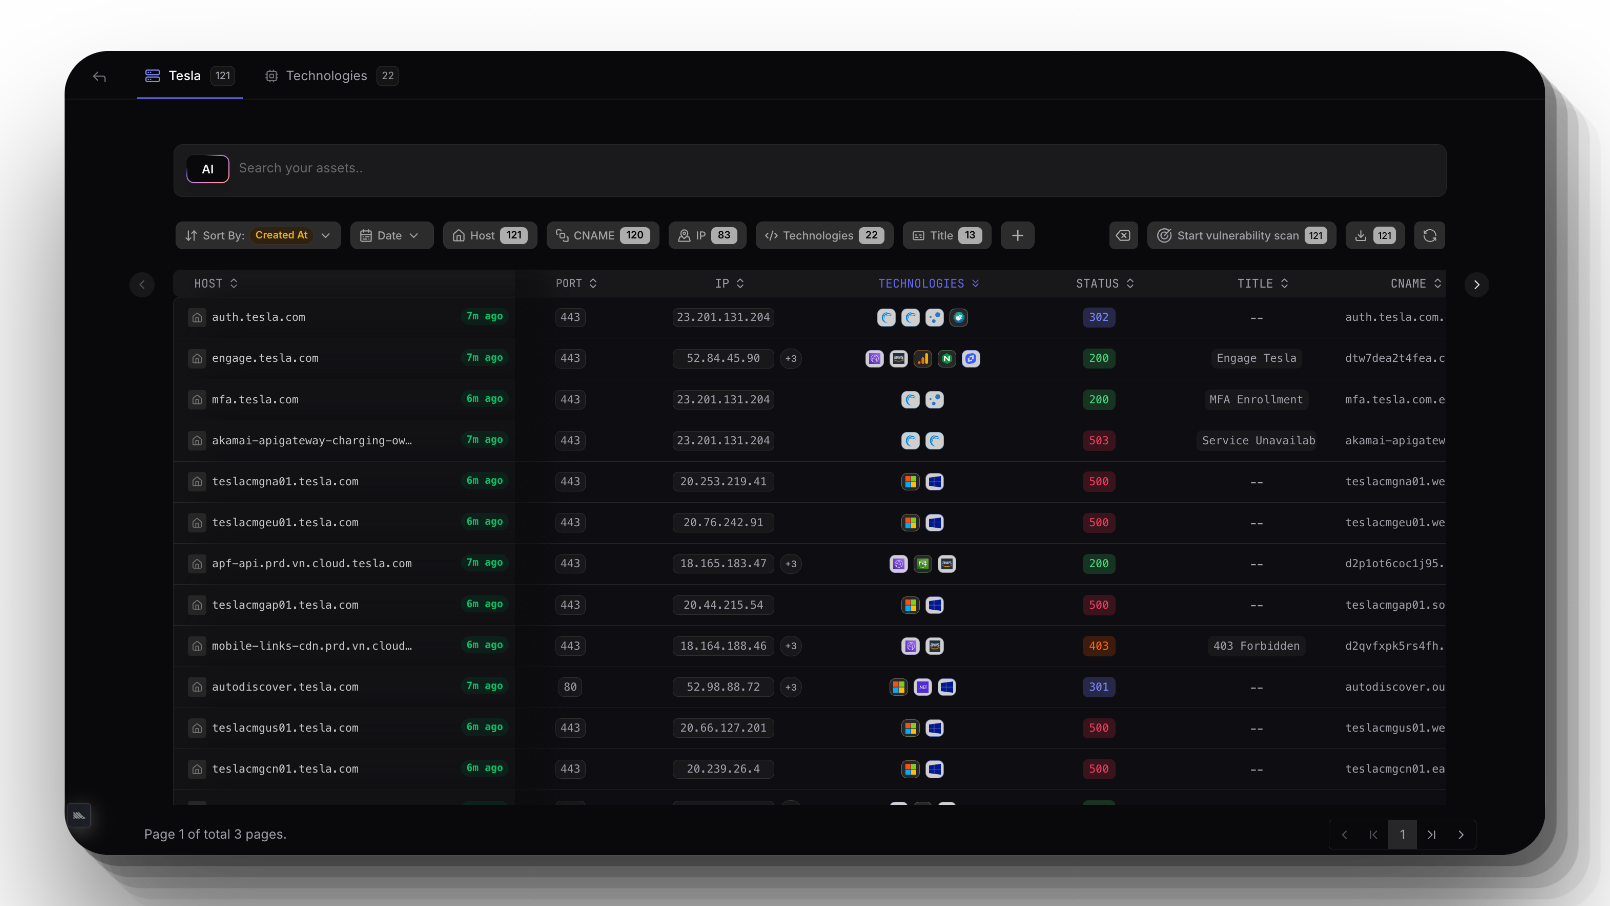
Similar to the Nuclei Results Dashboard Upload, you can now enable dashboard support when running httpx. You also have the option to upload existing output (JSONL format only) using simple, familiar flags.
If you've been following our community, you know we've been working hard to prepare the ProjectDiscovery Cloud Platform for everyone. Our aim is to support all community members using PD tools—from bug bounty hunters to large enterprises—who want cutting-edge solutions to detect exploitable vulnerabilities in their external attack surface.
Let's explore how to enable and utilize the httpx dashboard
To enable dashboard upload, you first need to set up an API key with httpx. Chances are you're already doing this, but if not, here's a short demo:
- Make sure you're using the latest httpx version (at least v1.6.7). You can run
httpx -versionto confirm this. - If you need to update, run
httpx -upor check out the PD Tool Manager to ensure you always have the latest PD releases. - Visit https://cloud.projectdiscovery.io to generate an API key for PDCP. (Select "Sign up" if you don't have an account already!)
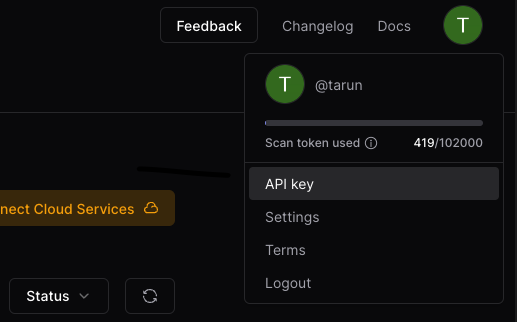
- Once you've copied that API key, run
httpx -authin your terminal. - Paste your API key when prompted. You should see
Successfully logged in.
Upload on the Fly
Once you have the PDCP API key set up, enabling upload to the dashboard is as simple as adding the -pd or -dashboard flag to your command. That's it!
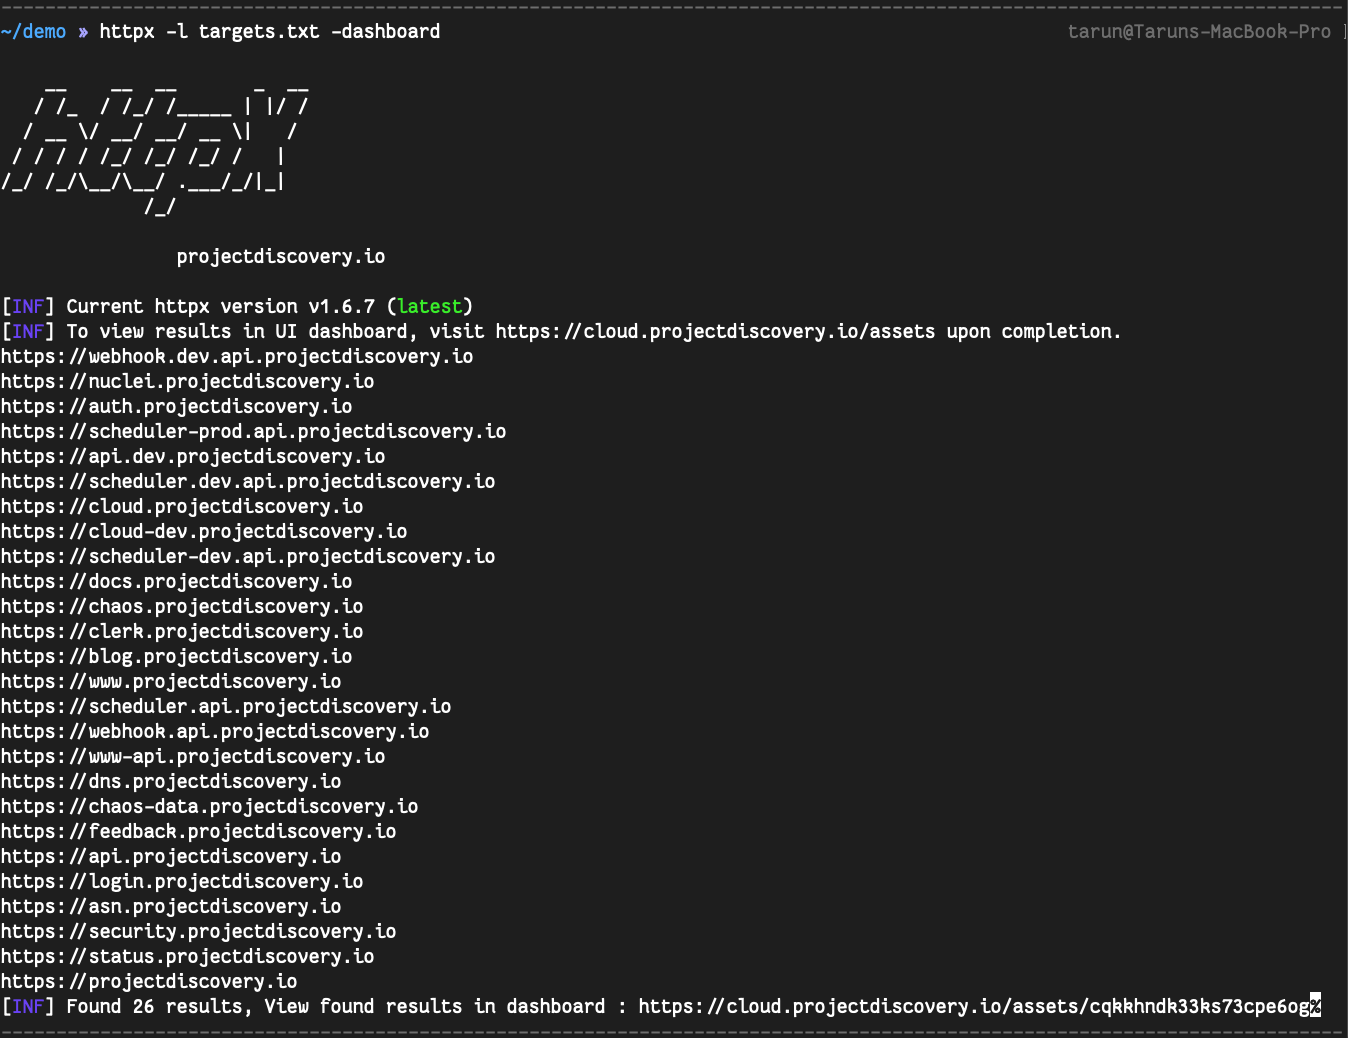
After the scan completes, you'll see a direct link to your dashboard. Just open it and explore our curated dashboard for hackers.
If you'd like to organize your assets, use the -asset-name flag to specify the name of the asset group.
Upload Existing httpx Output File
You're likely already using the JSON lines output of httpx (with the -json flag) in your workflow or for storing full structured data. If you have this format or frequently use httpx this way, you only need to use the -pdu or -dashboard-upload flag and specify the JSON lines file you already have.
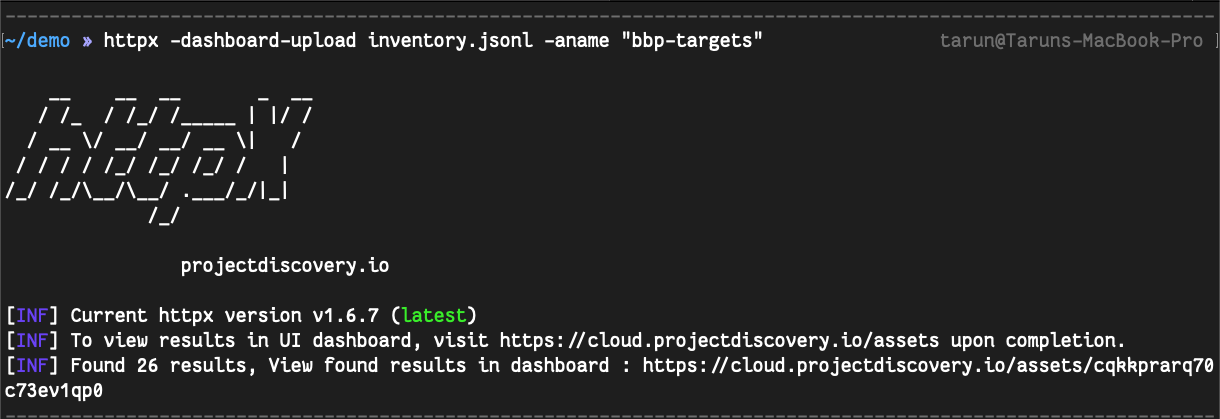
Regularly Updating Assets
You'll likely run httpx on subdomains of a set of root domains regularly and maintain a set of results. If that's the case, we've got you covered. Just specify -aid with the actual asset ID value. You can find this ID in the current URL of the asset dashboard: https://cloud.projectdiscovery.io/assets/$asset_id
Always Enable Dashboard
If you love this dashboard and want it to be used every time you run httpx—or if you want to control upload behavior from the environment—you can now do so by setting the following environment variable:
ENABLE_CLOUD_UPLOAD=trueFlags
CLOUD:
   -auth                           configure projectdiscovery cloud (pdcp) api key (default true)
   -pd, -dashboard                 upload / view output in projectdiscovery cloud (pdcp) UI dashboard
   -aid, -asset-id string          upload new assets to existing asset id (optional)
   -aname, -asset-name string      assets group name to set (optional)
   -pdu, -dashboard-upload string  upload httpx output file (jsonl) in projectdiscovery cloud (pdcp) UI dashboard
Manage Assets
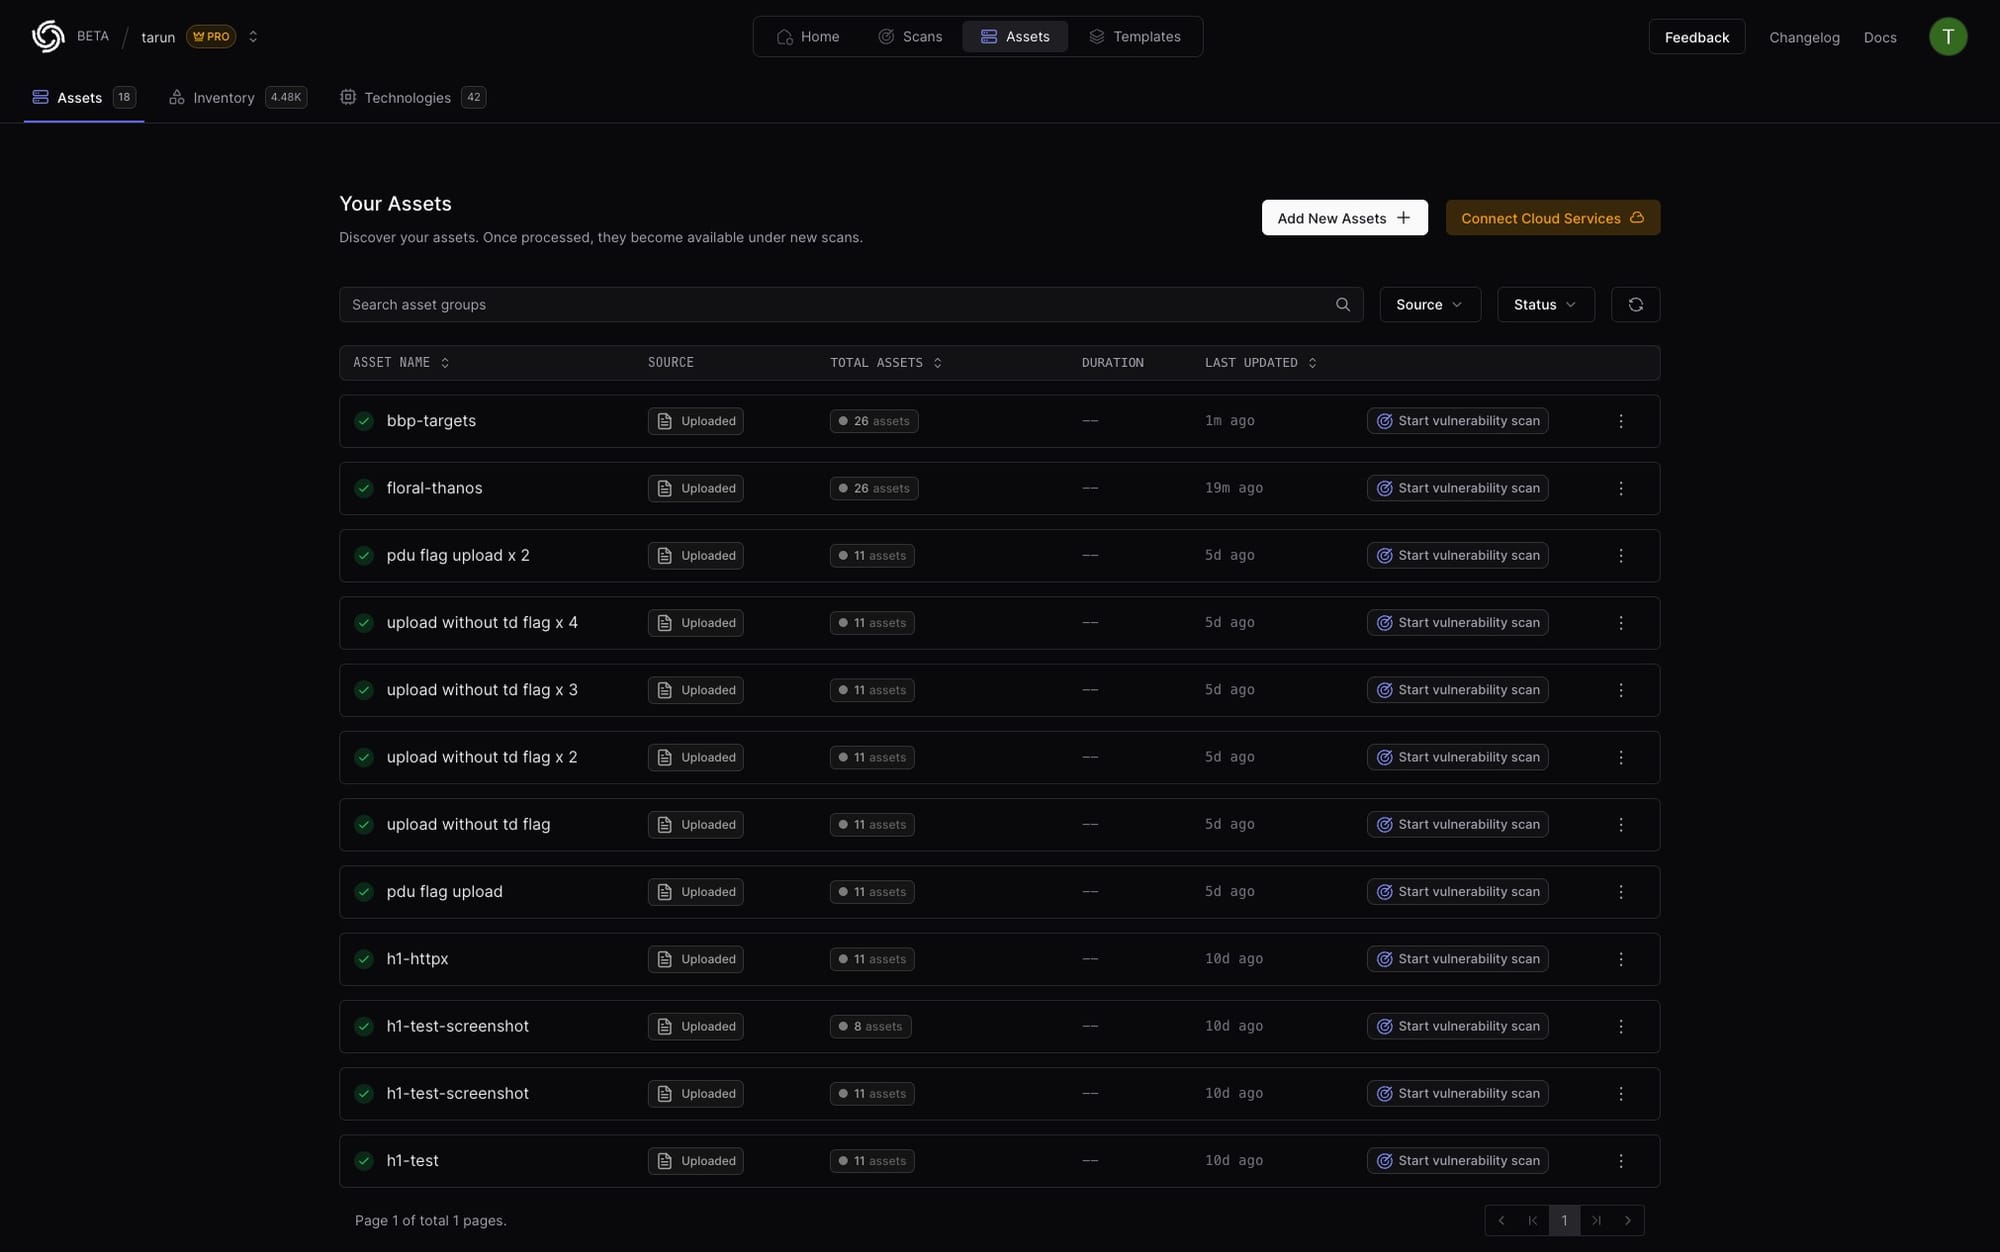
The PDCP Assets Tab displays all your assets in a convenient list. This feature allows you to organize asset groups by use case. Pro Plan users can instantly initiate a scan on any asset group by clicking Start Vulnerability Scanning.
Filter Assets
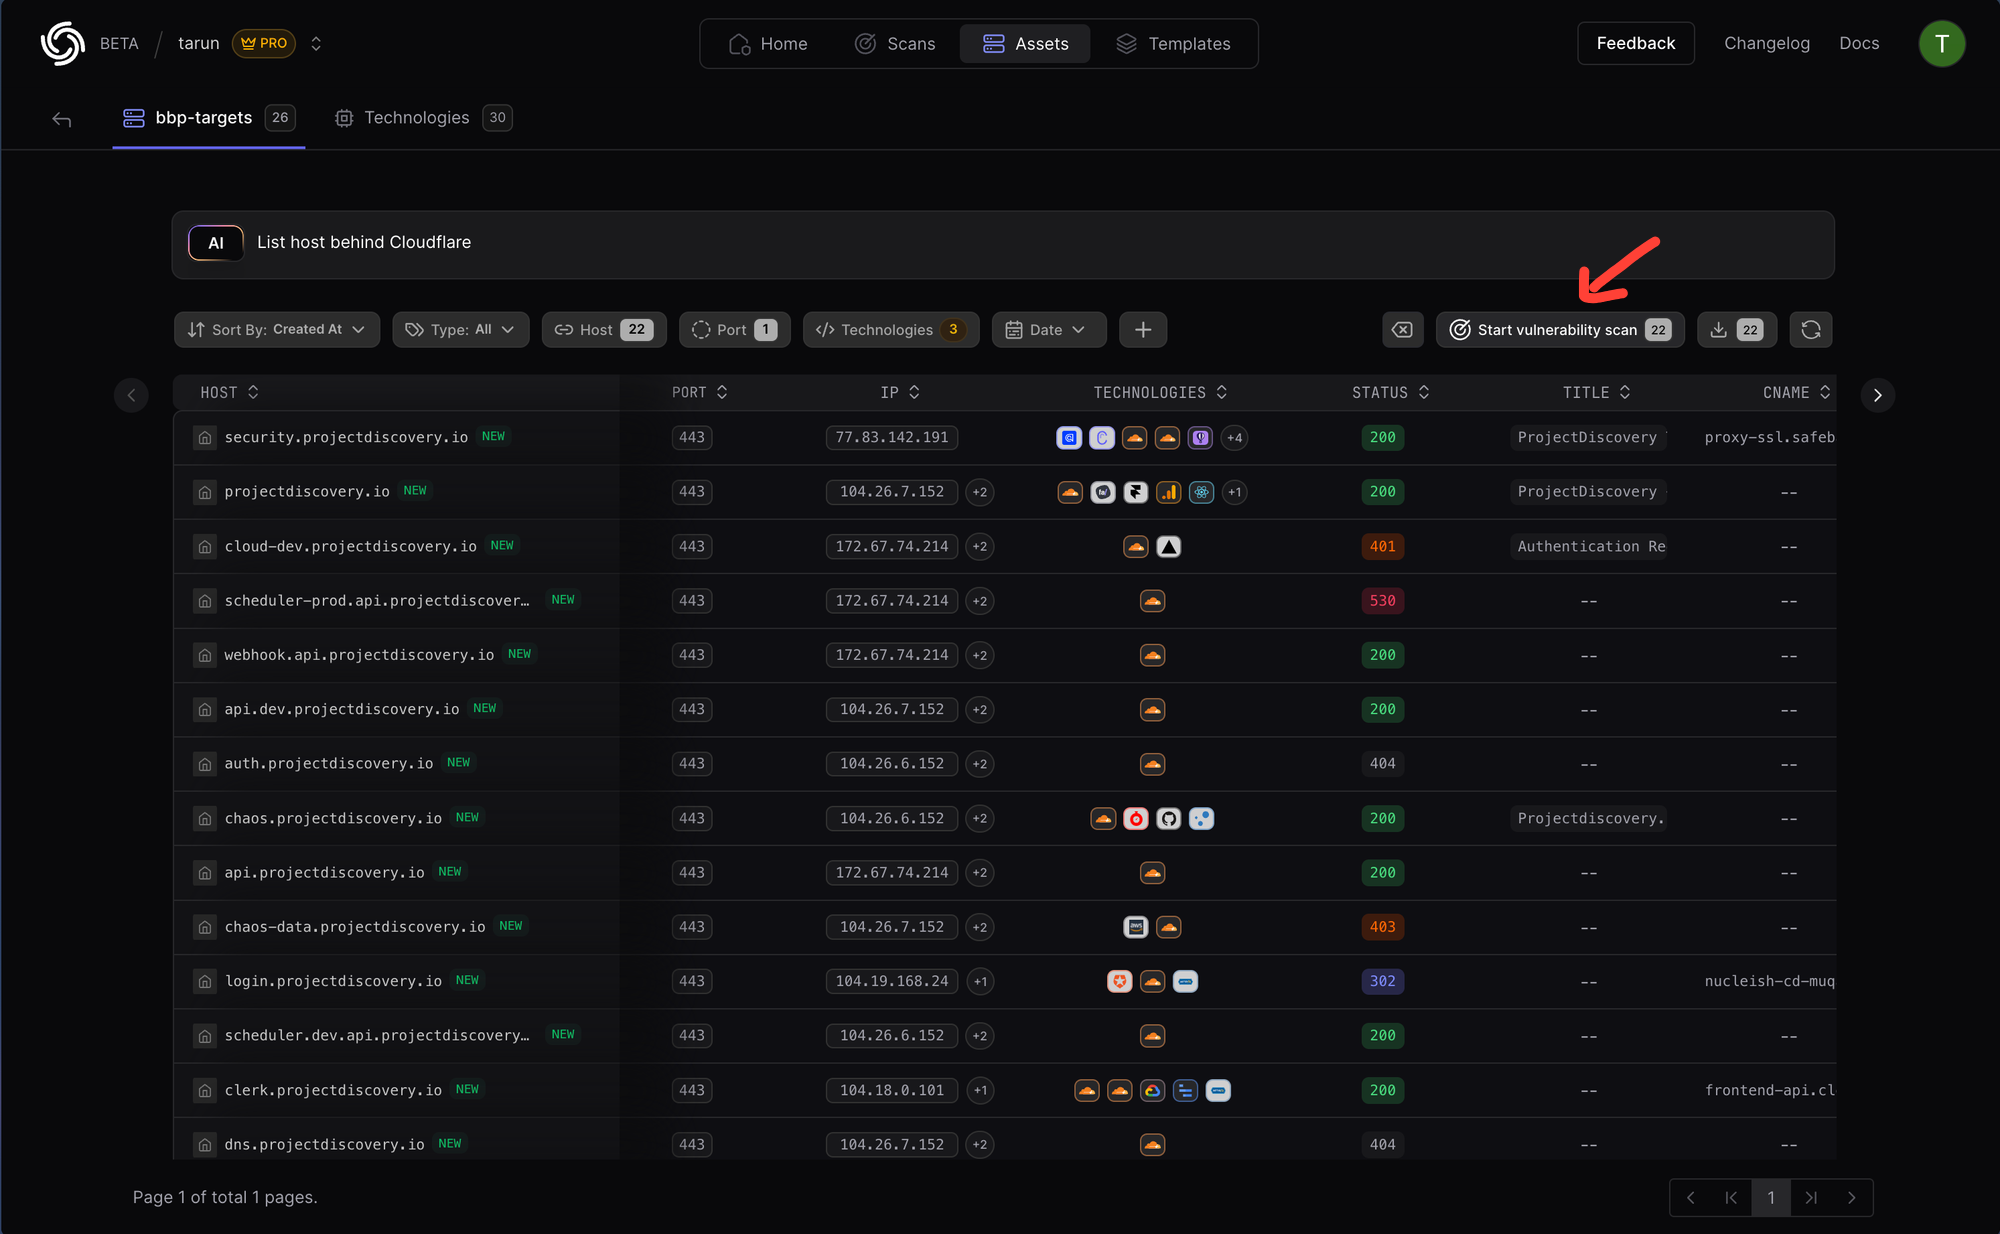
You can also use filters to narrow down to specific targets of interest. And, you can use the AI Search Bar to generate filters using Natural Language 😄
Pro Plan users can instantly initiate a scan on filtered assets by clicking Start Vulnerability Scanning
ProjectDiscovery at DEF CON 32
If you're attending DEF CON or will be in Las Vegas on Thursday, August 8th, join us for an evening of open-source security tools, networking, and fun 🛠️🍻 (plus exclusive PD swag 🧢). Limited spots available!
如有侵权请联系:admin#unsafe.sh