2024-8-17 00:0:20 Author: hackernoon.com(查看原文) 阅读量:3 收藏
Table of Links
2. Methods
2.1. Modeling Panspermia and Terraformation
2.2. Identifying the Presence of Terraformed Planets and 2.3. Software and Availability
3. Results
3.1. Panspermia can increase the correlation between planets’ compositions and positions
3.2. Likely terraformed planets can be identified from clustering
5. Acknowledgements and References
APPENDIX
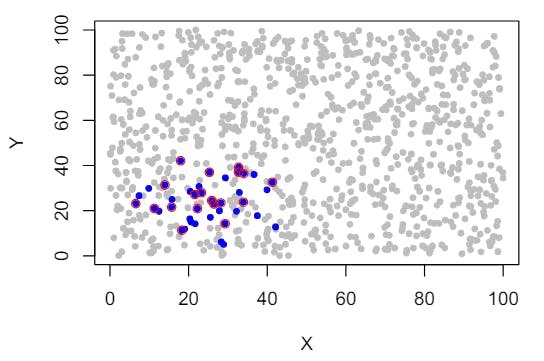
3.2. Likely terraformed planets can be identified from clustering
We next attempted to select planets with high potential for having undergone terraformation. Based on the idea that terraformed planets are likely to have similar compositions, we start by clustering planets based on only their compositions, at each simulation iteration (see Methods 2.2.3). The key question is—of the clusters identified, which ones likely contain terraformed planets? To address this, we selected clusters (without using the ground truth labels of which planets were terraformed) by looking at the effect they have, when removed, on the residual space’s Mantel coefficient (Mantel contribution > 0; Fig. 3). We further selected clusters based on their planets’ spatial localization (IQR ≤ 25.2; Fig. 4).

With both of these selection criteria applied, we detect a total of 247 clusters across all terraformed ratios—the earliest first appearing at a terraformed ratio of 0.04 (Figs. 5, 6). Selected clusters range in size depending on the terraformed ratio, with 1-3 clusters appearing at most simulation iterations between terraformed ratios of 0.04 to 1. Additionally, we find that the Mantel pvalue of detected clusters, measured in isolation, is low

(Fig. A5). Changing the parameters used in clustering, or the thresholds used for IQR and MC could identify planet clusters either earlier (by increasing sensitivity) or later (by increasing the IQR threshold).
After selecting clusters, we evaluate if they actually contain terraformed planets (Figs. 7, 8). We find that across the full range of terraformed ratios, they have extremely high specificity—close to 1.0—correctly rejecting non-terraformed planets as being nonterraformed. On the other hand, detected cluster sensitivity—a measure of correctly detecting terraformed planets as being terraformed—ranges from 1.0, down to near 0.0. Perhaps surprisingly, but encouragingly, the highest sensitivity clusters appear when fewer planets are terraformed. This is could be explained by the fact that throughout the simulation clusters remain small (in terms of number of planets), and the rest of the planets often get classified as noise (this being due to the sensitivity to elbow selection). As a consequence of decreasing sensitivity, accuracy—the proportion of all planets correctly classified—also decreases.
When we raise the MC threshold used for cluster selection (to 0.25 or 0.5), we find that each of these summary statistics improves, reflecting the fact that the more the MC threshold is raised, the more data is excluded from higher terraformed ratios, meaning that the bulk of the


data remaining is from early clusters with high sensitivity and high accuracy (Figs. 7, 8).
Authors:
(1) Harrison B. Smith, Earth-Life Science Institute, Tokyo Institute of Technology, Ookayama, Meguro-ku, Tokyo, Japan, and Blue Marble Space Institute of Science, Seattle, Washington, USA ([email protected]);
(2) Lana Sinapayen, Sony Computer Science Laboratories, Kyoto, Japan and National Institute for Basic Biology, Okazaki, Japan ([email protected]).
This paper is
如有侵权请联系:admin#unsafe.sh