2024-8-21 03:0:34 Author: hackernoon.com(查看原文) 阅读量:2 收藏
The first time I tried Azure Data Studio a few years ago, I was not impressed because it was a simple copy of Visual Studio Code. The built-in features were primitive; besides CRUD operations, there wasn’t much else. As a result, the tool couldn’t compete with the classic SQL Server Management Studio (SSMS). However, I changed my mind after giving this program a second chance.
Today, I want to walk through the essential features that you’d use day-to-day so that we can answer the question: is it worth switching to Azure Data Studio today?
Profiler
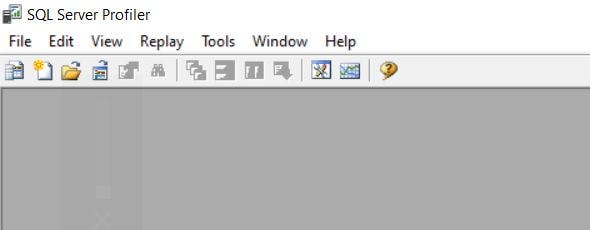
Even if you’ve never used SQL Server Profiler (included in the SSMS package), you can get an idea of it just by looking at the screenshot below. The interface, functionality, and existing bugs stayed somewhere between SQL Server 2005 and SQL Server 2008. This is SPARTA a legend!

But it seems like it’s time to move away from the classic because Azure Data Studio does address the following needs:
- Profiling on-premises servers and PaaS solutions (SQL Profiler, for instance, doesn’t work with Azure SQL).
- It has a user-friendly interface.
- Works on Linux and macOS.
The second argument may seem subjective, but let’s compare how you set up the filter in both apps.

In the classic control (see the image above), you must be a single, double, triple, and continuous click guru. I’m not joking — a setup process is essentially a combination of these types of mouse actions. On the other hand, Azure Data Studio provides something that, in 2023, you’d call a genius solution. The “Add a clause” button and a small cross for deleting conditions are available (see the image below). As simple as that!

It would be wrong not to mention my favorite trap related to filters in SSMS. You must wrap the filter text in percentage symbols % (as shown in the image above). The expected event won’t be captured if you don't do this. How many developers' nerves were lost due to this intricacy? We can only guess.
In other aspects, Azure Data Studio’s profiler doesn’t differ from its predecessor. It offers the same list of events with the ability to stop and start new sessions. It hasn’t introduced any significant changes in CPU and Duration metrics, whose meaning is somewhat obscure. However, using the profiler has become much more straightforward.

Execution Plan
When you read an execution plan, it’s crucial to understand the volume of data being moved between operators. In SSMS, you can judge by line width; the wider a line is, the more data there is. However, Azure Data Studio’s developers made it slightly more intuitive. They added numbers indicating the row count and used width with boldness. So, a line with more data looks wider and bolder. Compare the images below.


The new version appears to be more informative while preserving its initial simplicity.
Another Azure Data Studio feature that I highly appreciate is Highlight Expensive Operator. You can easily find the most problematic part of the plan in just two clicks, as the program highlights it in red (see the image below). Previously, you had to navigate the entire diagram to find the bottleneck. So, the new feature saves a lot of time, especially when analyzing multiple queries.

Furthermore, Azure Data Studio introduced the ability to view the execution plan as a table. I haven’t yet leveraged the tabular view in the actual use case, but viewing a list of operations sorted by cost or execution count (see the image below) might be helpful.
Chart
The last feature I’ll mention is the Chart visualization. In Azure Data Studio, you can create charts directly from datasets. Below, you can see an example of a SELECT statement with a simple GROUP BY and COUNT (disposition of responses “Yes,” “No,” “Don’t know”).

This is not a revolution. But at least it eliminates the need for additional software (such as Excel) that developers often use to build some charts quickly or conduct a basic data analysis. I’m confident that business analysts will appreciate this feature, too. It is a straightforward way to visualize data and is a valuable addition to the toolkit.
Features that are missing
Query Store
Query Store is a set of tools for analyzing performance statistics. For example, it helps identify queries that are executed most frequently or consume a lot of resources. Currently, Azure Data Studio lacks this feature.
Database Diagrams
This is another feature that hasn’t changed in decades. However, Azure Data Studio does not bring an alternative. I’m confident that suitable extensions will likely appear soon because implementing a table relationship diagram does not sound that complex.
Administration Features
Azure Data Studio doesn’t provide anything like Copy Data Wizard, Error Log Viewer, Multi-Server Query, etc. You can view the complete list of missing functionality
Conclusion
Azure Data Studio is an open-source program that offers rich capabilities for working with SQL servers. Even query visualization comes out of the box, so you don’t need to install extensions. The tool is much less greedy for resources than its predecessor and commonly works faster.
I recommend switching to Azure Data Studio if you are a developer or just need to make queries to SQL Server occasionally. It is a modern and convenient tool for daily use.
Have you already tried Azure Data Studio? I’d be glad to hear your opinions in the comments.
如有侵权请联系:admin#unsafe.sh