
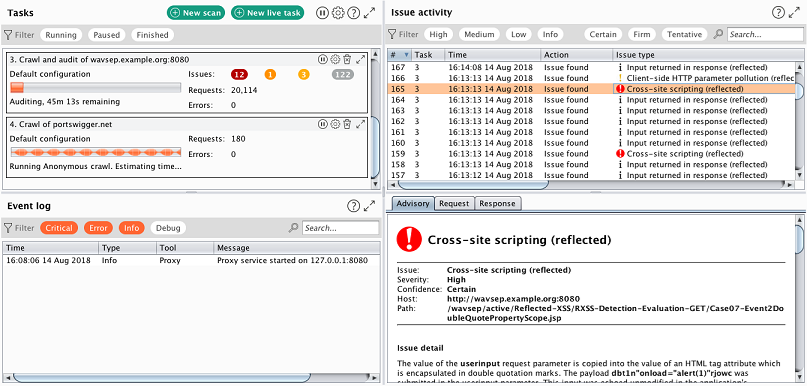
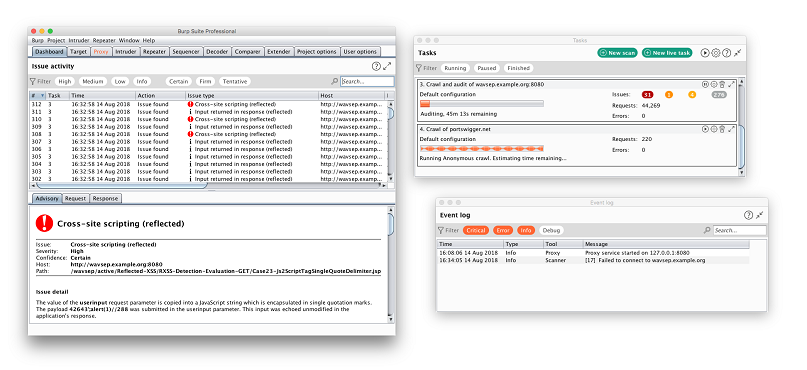
Burp Suite is getting a brand new dashboard, which lets you monitor and control its automated activity:
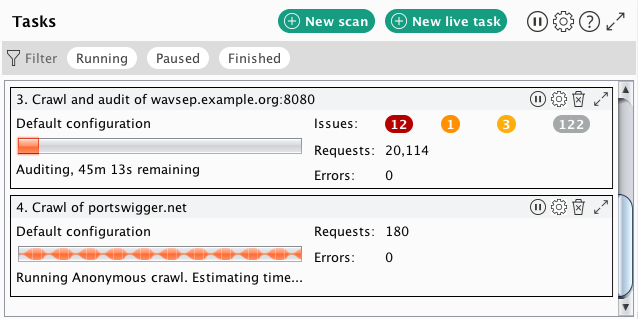
The dashboard shows the currently configured tasks, with a summary of their progress and results:
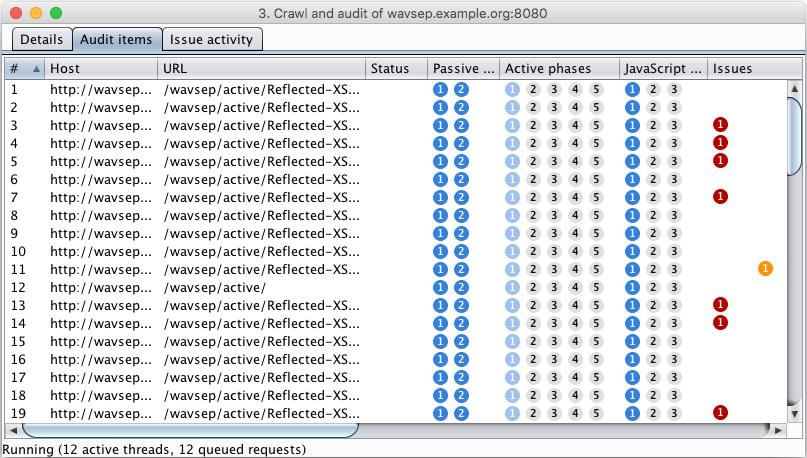
You can pause and resume individual tasks, or all tasks together. You can reorder tasks by dragging them within the task list. And you can open a pop-out window for individual tasks to see more details:
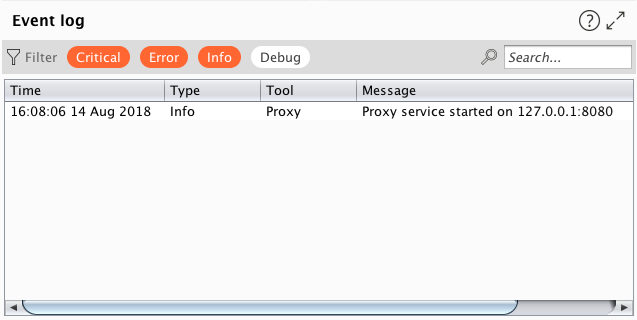
The previous alerts tab has now moved into the dashboard's event log:
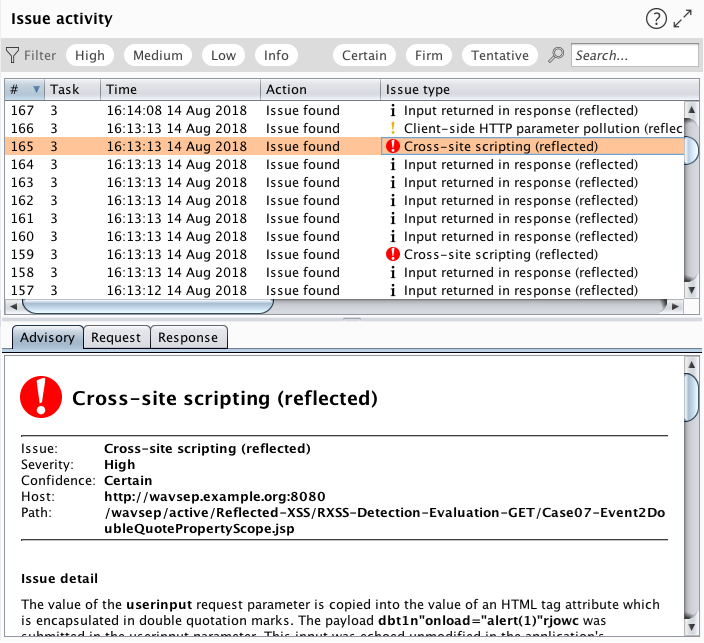
The issue activity panel shows details of issues as they are reported by all scanning tasks:
You can click the "pop-out" icon in the corner of each panel to show it as a separate window, so you can keep it visible while working in other areas of Burp:
Not least, for users who just want to launch a scan, there is a nice green button to do exactly that. Which is a big improvement in usability over seeing an empty site map and no indication of how to proceed.
如有侵权请联系:admin#unsafe.sh