2019-07-15 16:00:00 Author: www.brendangregg.com(查看原文) 阅读量:139 收藏
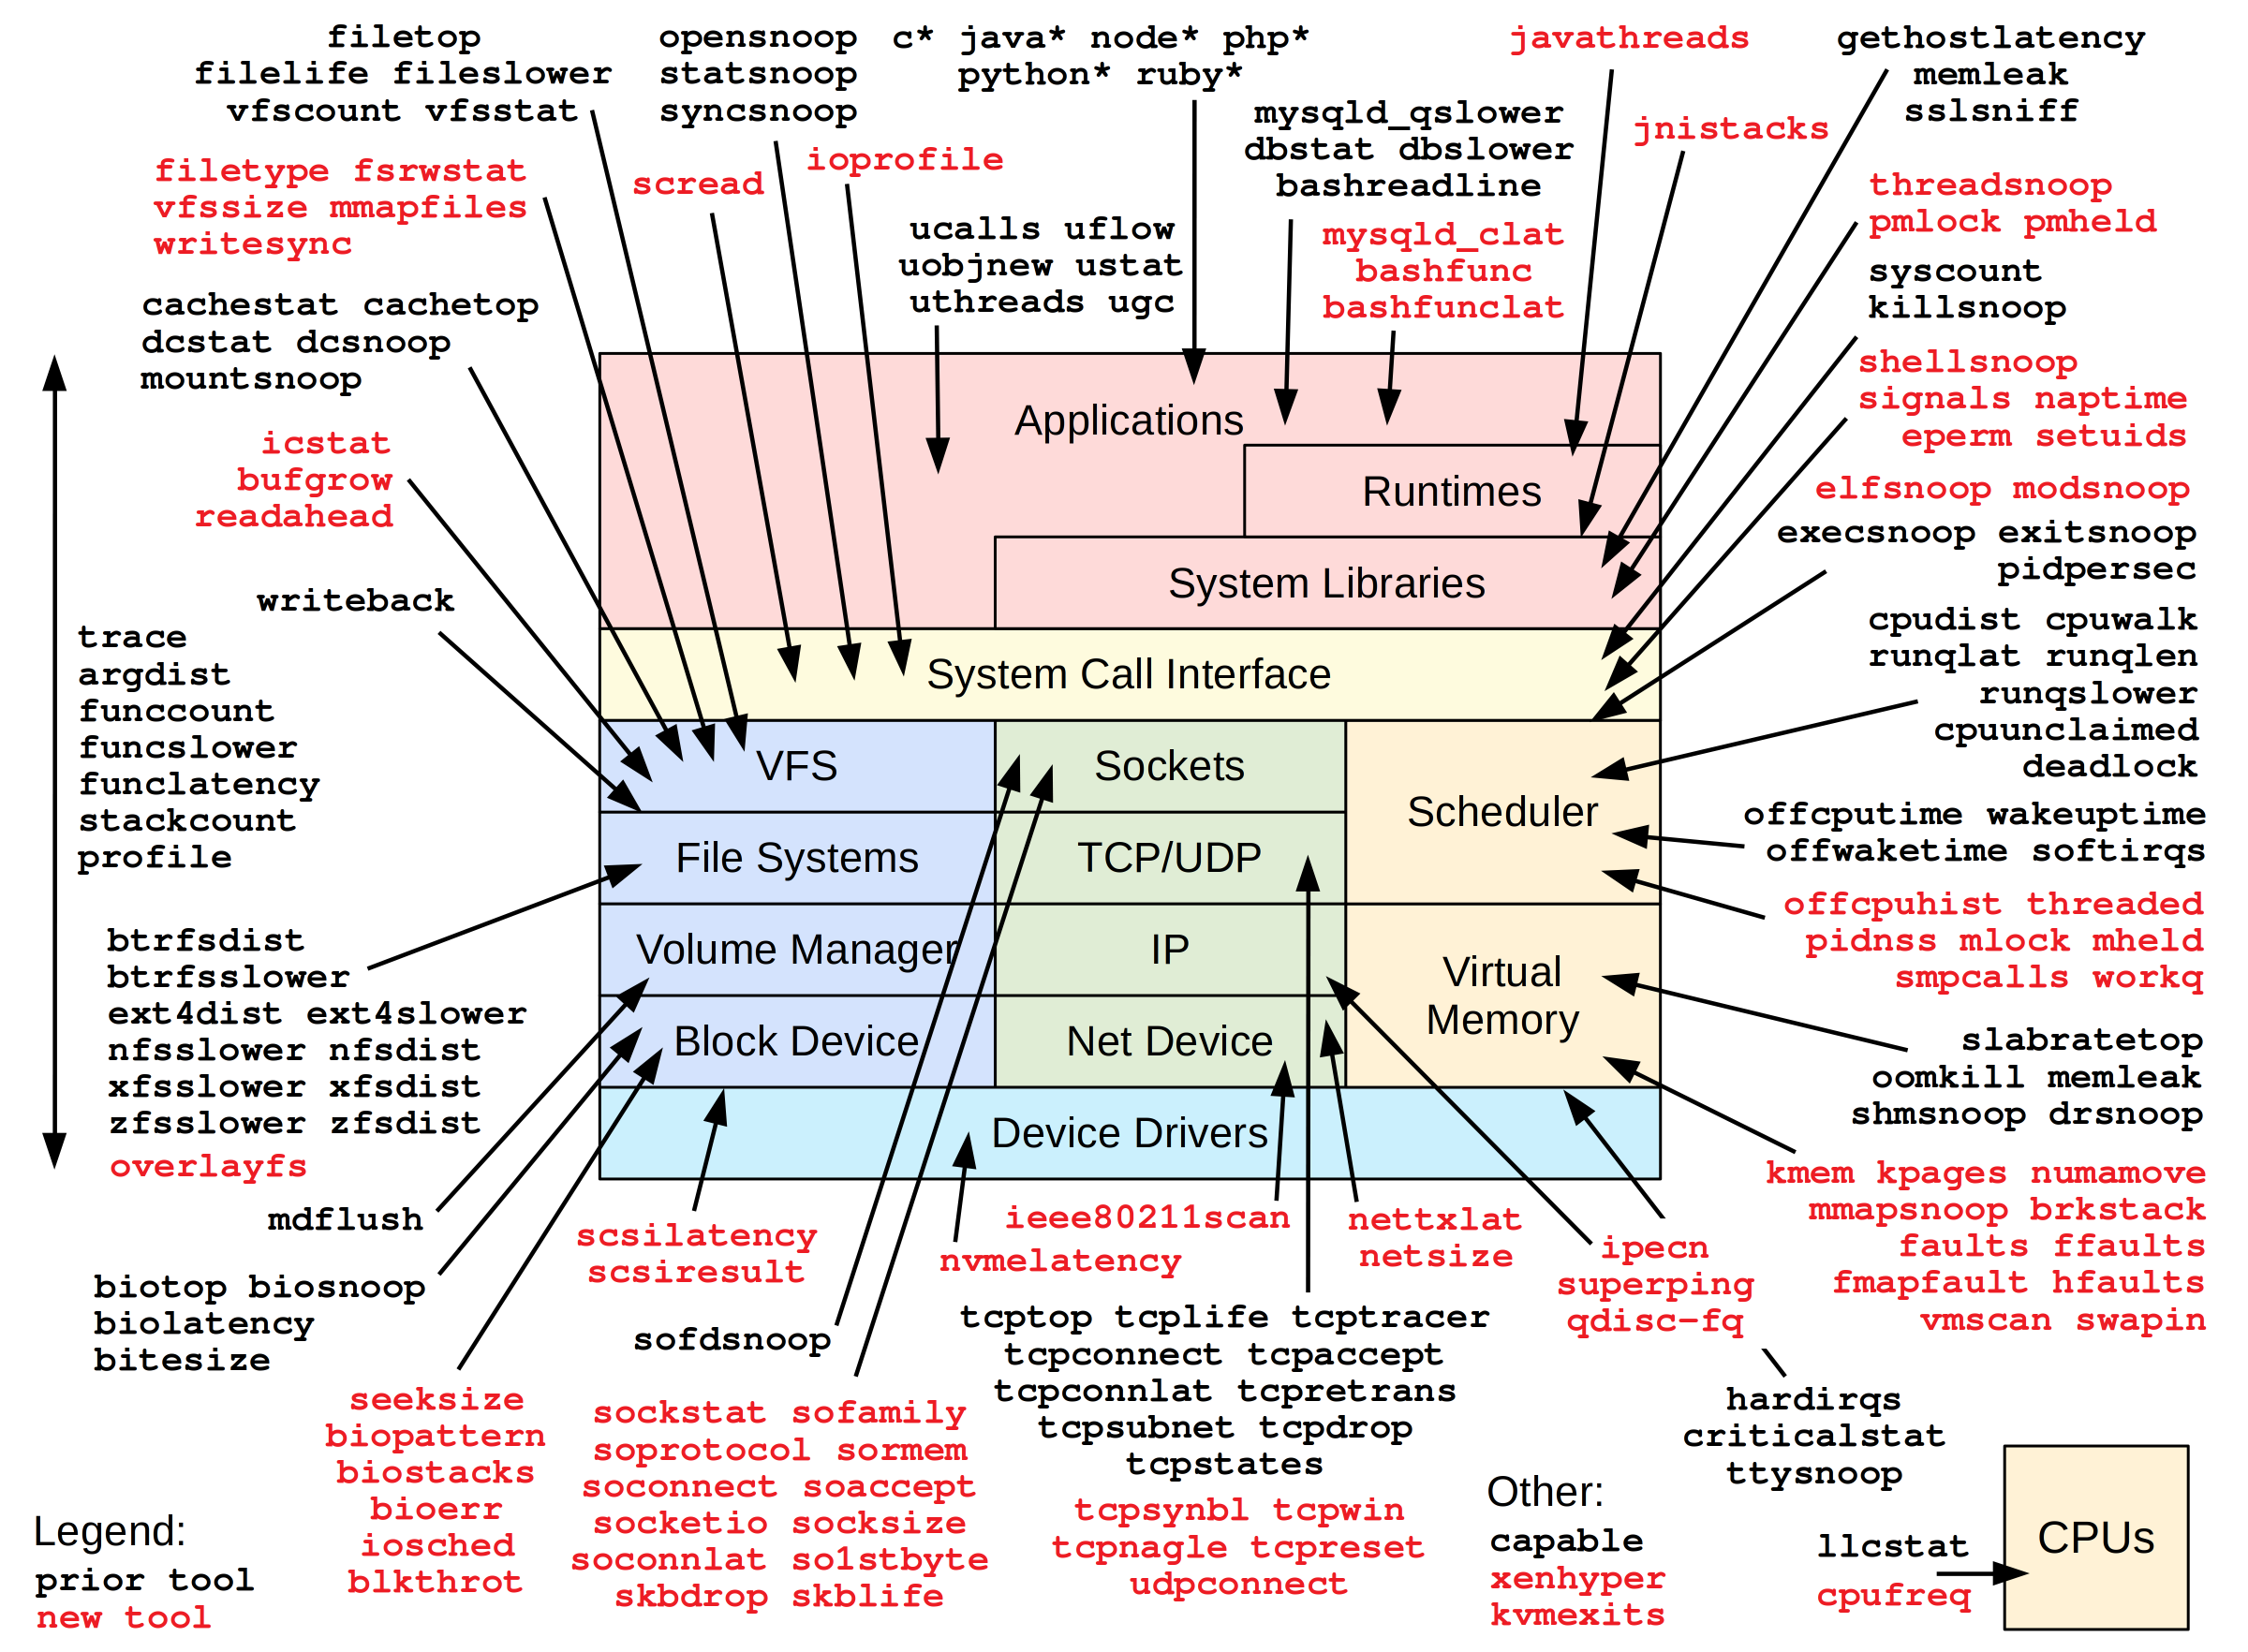
BPF (eBPF) tracing is a superpower that can analyze everything, and I'll show you how in my upcoming book BPF Performance Tools: Linux System and Application Observability, coming soon from Addison Wesley. The book includes over 150 BPF observability tools that you can run to find performance wins and troubleshoot software, and also shows you how to write your own. Over one hundred of these BPF tools are newly-developed for this book; you can see many of them in this diagram:

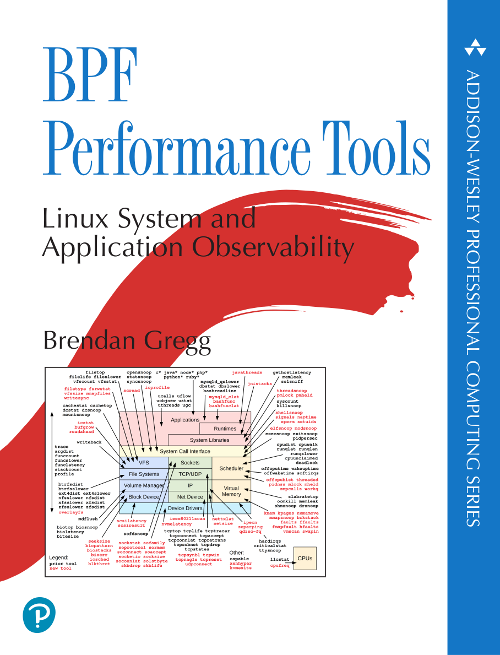
I've found this diagram to be a useful reminder and checklist when debugging production issues at Netflix, and I have it printed on a wall so I can glance at it. You may find it helps you, too, which is why it is on the cover.
Since BPF does so many things, it is becoming a technology name and no longer an acronym. It originated as Berkeley Packet Filter (BPF), an in-kernel execution engine that processes a virtual instruction set, and has been extended (aka eBPF) for providing a safe way to extend kernel functionality. BPF is in the Linux kernel.
Why Your Book?
BPF is a new in-demand technology, and I expect that, over time, a dozen or more books about it may be published – as happens for other hot new technologies. Guess how many books there are about Docker? I lost count at 30! Some other future BPF books may be good, and I'll recommend them as appropriate. To answer the question why you should buy my book:
- It is about using BPF for performance analysis, and is written by a veteran performance engineer and technical trainer (myself).
- At over 700 pages, it covers CPUs, memory, disks, file systems, networking, multiple languages, applications, containers, hypervisors, security analysis, and the Linux kernel.
- It contains over 150 tools (often with source code), including over 100 brand-new tools mostly developed by myself, so that you can get started right away finding performance wins in any of those areas.
- It also covers over 30 traditional tools (iostat(1), perf(1), etc) so you can use the right tool for the job, even when that tool is not BPF.
- It goes far beyond what you can find online, which I previously summarized (learn eBPF tracing).
- It focuses on the recommended BPF tracing front ends: BCC and bpftrace.
- It shows production screenshots and use cases from a major site (Netflix), including gotchas we've hit in production, such as fixing stacks and symbols, and managing overhead.
- It was developed with the help of many members and leaders of the BPF community.
- I've been helping lead BPF observability since 2014, and I'm a major contributor and maintainer for the front-ends. Among other things I created the tutorials and reference guides.
- This is also my fourth book to cover tracing.
I was previously a professional technical trainer for Sun Educational Services, where my classes included DTrace, another tracing tool similar to BPF tracing. I learned firsthand how to bring beginners from different backgrounds up to speed. Early courses covered only the DTrace language, and expected students to figure out what to do with it. I found it was more effective to teach by example: explain the goals and targets of performance analysis, and then share real tools to meet those goals, and how to develop new ones. I've followed this proven approach in my book.
I've taken a break from training, but I have an opportunity to start again at Netflix, and I'll be using this book as materials for an internal BPF course. This course will be internal only: you'll need to join Netflix to attend my class! (Although I'll submit a short version for USENIX LISA/SREcon.)
bpftrace for the Win
We (the BPF community) began planning this book in 2017, and posted an announcement about it so that anyone looking could find it. At the time, BCC was great for complex tools, but it was still in development and changing. Also, no higher-level front end had been completed, but we knew we needed one beyond BCC. Since then, BCC has largely stabilized, and bpftrace has become a mature high-level front-end: one that is built from the ground up for BPF. bpftrace is already in use for production analysis at companies including Netflix, Facebook, and Shopify. It allows tool source to be so short and concise it can be included in the book in its entirety. It's like including pseudocode that you can run.
The last nine months have been hectic as I and others have added features to bpftrace, fixed bugs, and stabilized the API. The analysis of so many things unearthed many bugs and missing parts; fixing these was good not only for the book, but also for bpftrace. A special thanks to Matheus Marchini, Willian Gasper, Alastair Robertson, Dale Hamel, Dan Xu, Augusto Mecking Caringi, and others, for all their work in these months. I'm also grateful that my fiancée, Deirdré Straughan, could find the time outside of her AWS job to do technical copy-edit. Thanks also to Alastair Robertson for creating bpftrace, Alexei Starovoitov and Daniel Borkmann for creating eBPF, and over forty other people involved in reviewing and contributing to this book.
A New Era for Linux Observability
As you'll see, this book is the start of a new era for Linux observability: the power to easily see anything and everything, in production. A time where you can pose arbitrary questions of the system, and it can answer them. A time where you are free to think about performance in new ways, and you can fetch hard data to support or disprove your new ideas.
Isn't BPF still evolving?
It is, but I had a static goal for the book: to get all of the included 150+ tracing tools to work. After many months of development, we've reached that milestone. I also involved the main BPF developers so I could document their planned work, to make this book as future-proof as possible.
BPF Type Format (BTF) is the only large change expected for tracing in the nearish future. It will provide kernel struct information beyond the linux-headers package, and is summarized in the book. A few of the tools declare missing structs as a workaround, and some years from now it will be possible to remove those workarounds.
What I expect to break sooner is the kprobe-based source code in the book. kprobes is considered an unstable API as it instruments kernel functions, and a kernel engineer may rename a function in a later kernel, breaking the tool. This is why the tools use the stable tracepoint interface whenever possible. But it's not always possible, and this is the nature of tracing. This is not, however, the hardest problem you'll face. The hardest problem is knowing what to do with BPF tracing, and even broken tools are a source of useful ideas. I will create a GitHub repository for the book tools as-is plus updated versions, and allow everyone to submit updates as they are found to be needed.
What about Systems Performance?
Systems Performance has sold very well (thanks, everyone!). It's recommended reading for new hires at several companies, including some teams at Facebook and SUSE. It is the encyclopedia of performance, covering many topics with a balance of theory and practice. BPF Performance Tools focuses on one topic only – observability – and goes deeper. The BPF book is about doing analysis right now, with these tools and capabilities. Now that I've finished it, I can do a second edition of Systems Performance (not right away…).
Good Luck
BPF is the hot new technology, and it is an extreme privilege to have written the book on it. I was determined to give you the best book imaginable, and not waste this opportunity. I hope you enjoy it, and it helps you find valuable performance wins. Good luck!
For URLs where to find the book and updates, please see my website BPF Performance Tools (book).
Discussion on hacker news
You can comment here, but I can't guarantee your comment will remain here forever: I might switch comment systems at some point (eg, if disqus add advertisements).
如有侵权请联系:admin#unsafe.sh

