This post covers my solution to the Atredis BlackHat 2018 challenge, for which I won second place and a ticket to BlackHat. I'd like to express my gratitude to the author, the increasingly-reclusive Dionysus Blazakis, as well as Atredis for running the contest.
As you can see from the screenshot in the tweet linked above, and reproduced below, once you connect to the network service on arkos.atredis.com:4444, the system prints information about the firmware and hardware version, as well as the memory map. Following that is the message-of-the-day, which contains a reference to 8-bit computing.

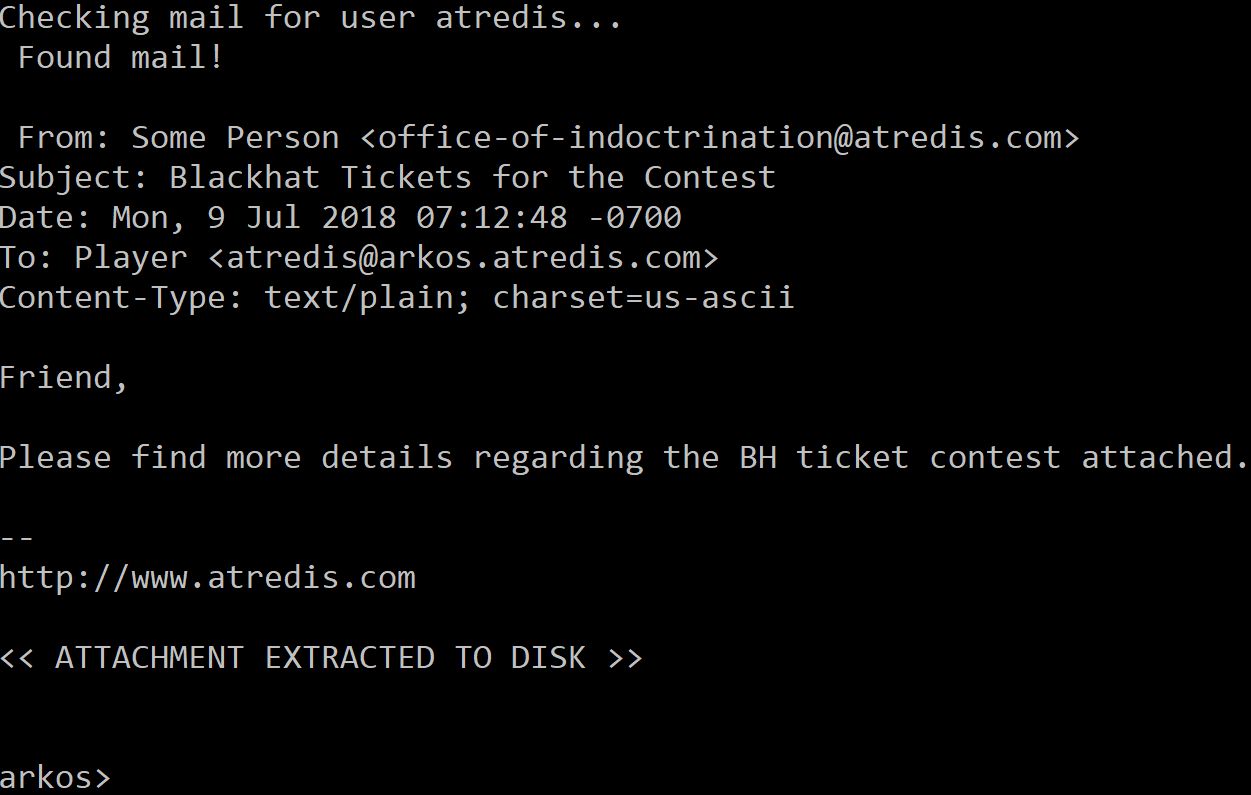
It also prints the contents of an email, which makes reference to an attachment having been written to disk. It seems like the immediate goal of the challenge is clear: retrieve the attachment from disk.
At about 8:30PM, I logged into the system for the first time. The challenge had been released at 2PM and I figured many people would have already solved it. Not knowing what to do at the prompt, I typed "help". The system replied by printing information about two commands: "help" and "read", with an example of how to use "read":
'read F400' reads the byte at $F400
I ran that command and it came back with the value 31, or '1' in ASCII. I ran the command for a few adjacent addresses and this location seemed to contain the hardware version string "1.0.3 rev A", part of what was printed initially in the first messages upon connecting to the service.
At first blush, there wasn't much more to do than read bytes off of the system at specified addresses. However, this challenge was not my first rodeo in the embedded reverse engineering space. I was immediately reminded of an exploit I once wrote for a SOHO router, where, once I obtained its memory map, I used an arbitrary read vulnerability to dump its memory contents so I could further analyze the software in IDA. I decided to do something very similar here, minus the need for an arbitrary read vulnerability.
Although I don't like Python much as a programming language, I do have to credit it for having an absurdly large standard library. In particular, while previously writing the aforementioned exploit, I made use of Python's Telnetlib module to automate interaction with the router. Nothing seemed to be stopping me from doing the same thing in this situation, so I spent about 10 minutes writing a 30-or so line Python script to log into the device, repeatedly send "read" commands, parse the resulting output, and save the results to a binary file. That functionality combined with the memory map printed by the device upon connection was all that was needed. You can find the dumped memory as .bin files here.
My script took nearly four hours to dump the memory. I don't know how much of that was related to the crappy Wi-Fi at my hotel, and how much had to do with other contestants hammering the server. Nevertheless, by the time I had the memory dump, it was 12:15AM and I had a business engagement in the morning. I needed to finish quickly so I could sleep.
I began by briefly inspecting the dumped memory contents in a hex editor. The three regions which, in total, encompassed the range 0x0000-0x1FFF, were entirely zero. Only a few bytes within 0xF000-0xFEFF were non-zero. In the range 0xFF00-0xFFFF, only the final three words were non-zero.
The most interesting dumped memory range was 0x4000-0xEFFF. It began with the strings that the server printed upon connection, as well as others that had not been printed. The most interesting strings were "write" and "call", which seem like they might have been commands that the user could execute on the system. After these strings, the memory dump had zeroes until address 0x8000.

At address 0x8000, there were 0x542 bytes of unknown binary data, with the remainder of the region being zeroes. Now that I've inspected the entire memory space, if this thing has any code in it at all, it must be the bytes at 0x8000-0x8542. The only other non-zero, unknown data is the few sporadic, isolated bytes previously mentioned in the range of 0xF000-0xFFF.
I connected to the system again and tried executing the "call" command I had discovered in the strings. I provided it the address 8000, which seemed to be the beginning of the code in the memory image. The thing printed:
JSR $8000
Apart from that, nothing happened. Next, I executed "call 7FFF" and the system reset. I took that as a positive sign.
At this point, I did not know what architecture I was dealing with. I had two hints. First, the message-of-the-day string made reference to 8-bit computing. Second, the "call" command had printed the string "JSR", which on some architectures is a mnemonic for "jump to subroutine" (i.e., the same functionality known as "call" on x86). The best logical guess right now is that we are dealing with an 8-bit architecture where the mnemonic for the call instruction is "JSR".
I wish I could tell you I used a systematic procedure in searching for such an architecture, but I would be lying. In retrospect, I could have loaded %IDASDK%\include\allins.hpp and searched for "jsr". The string occurs 32 times in that file, which would have given me a pile of possibilities:
- Angstrem KR1878
- DEC ALPHA
- DEC PDP-11
- Freescale M68HC12 or M68HC16 or HCS12
- Java bytecode
- Mitsubishi 740 or 7700 or 7900
- MOS M65 [e.g. 6502] or M65816
- Motorola 6809 or 68000
- Motorola DSP56000
- Panasonic MN102
- Renesas H8, H8500, SuperH, or M16C
- Rockwell C39
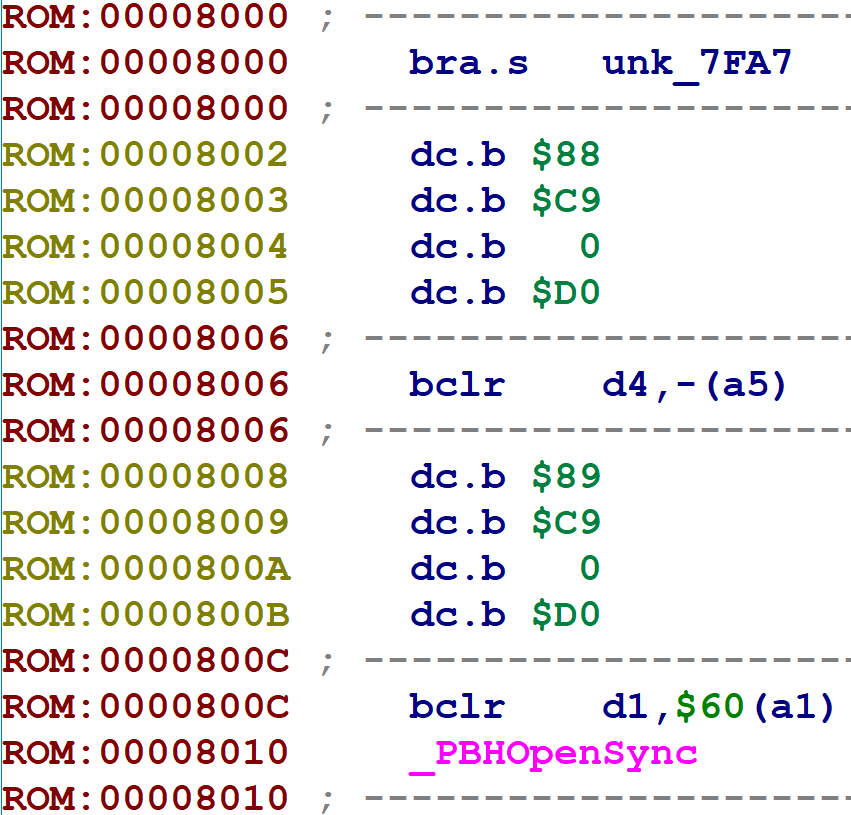
Instead what I ended up doing was searching Google for things like "assembly jsr". For any architecture suggested by one of my search results, I loaded the .bin file for the memory at 0x4000, changed the processor type to the one I was testing, and tried to disassemble the file using the relevant processor module. I ran through a few theories, among them System/360 and 68K. For each of my theories, IDA either refused to disassemble most of the code, or the resulting disassembly was gibberish. For example, when loaded as 68000, IDA refused to disassemble much of the code:
I almost gave up after about 15 minutes, since I had to be somewhere in the morning. But, a final Google search for "8-bit assembly jsr" brought me to a Wikibooks page on 6502 assembly language, which also has a "jsr" instruction. I loaded the binary as 6502, and lo and behold, the resulting disassembly listing looked legitimate. There were, for example, several loads followed by compares, followed by relatively-encoded short jumps to the same nearby location; loads of 0 or 1 immediately before a RTS (return) instruction, and so on.

It looked like I had found my winner.
Now that I seemed to know the architecture, I needed to load all of the memory dumps into a single IDA database for analysis. This is easy if you know what you're doing. If you do, you may as well skip this section. If you don't know how to do this, read on.
First, I loaded the file for memory range 0x4000-0xEFFF into IDA and changed the processor type to M6502.

Next I had to change the loading offset and the region that IDA considered as containing the ROM.

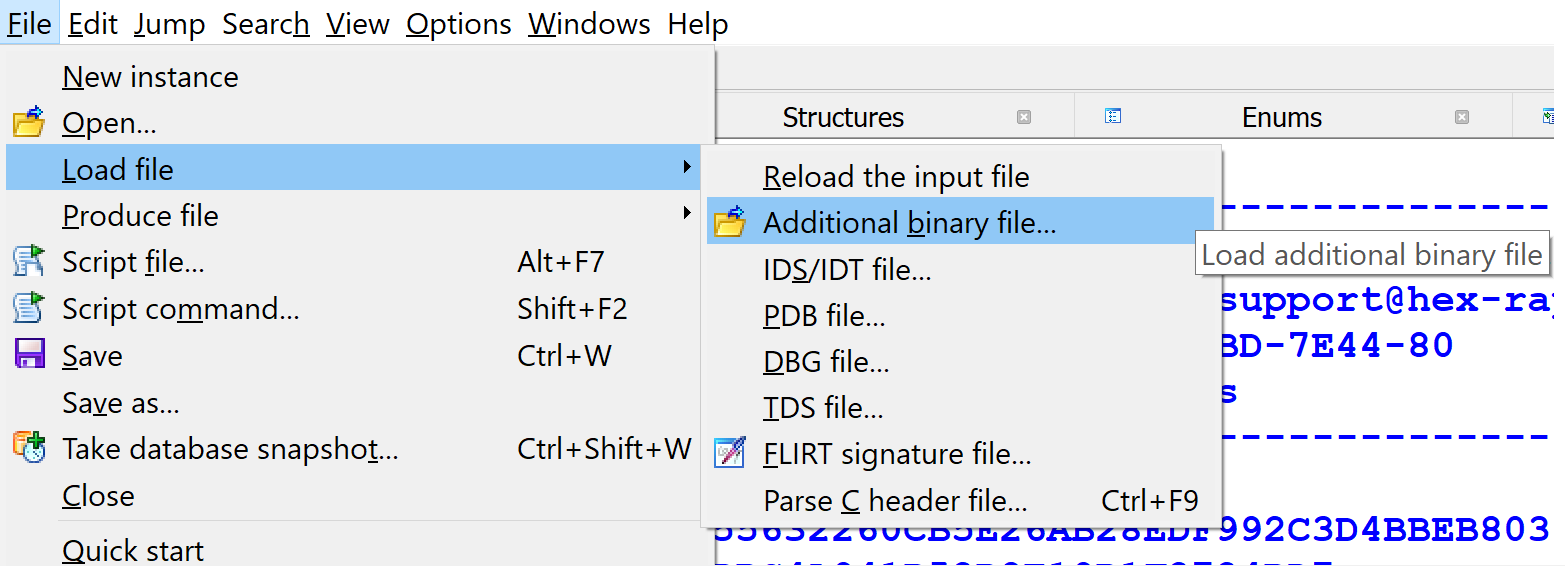
From there, I loaded each of the remaining memory dumps as additional binary files.
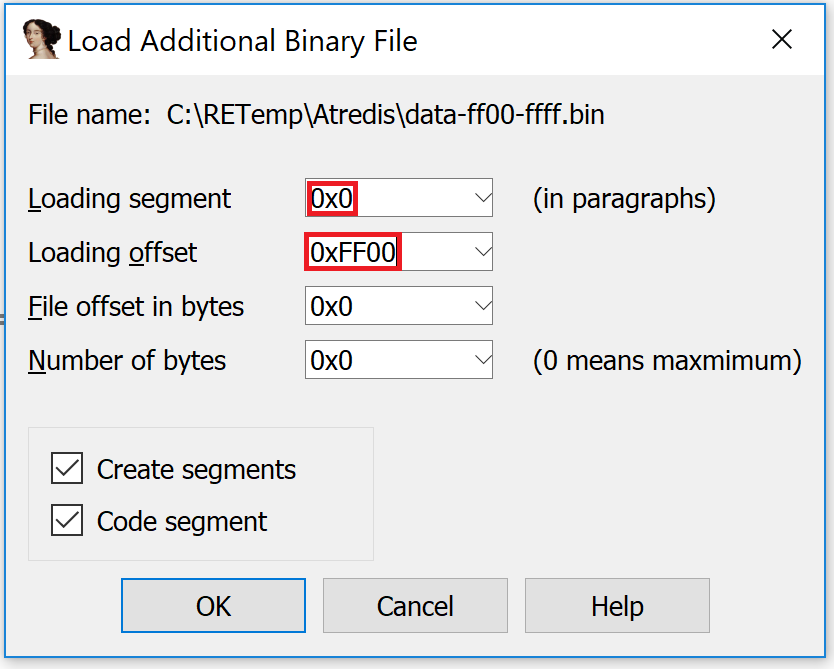
For each of those, I had to change their loading offset so they'd be represented at the proper location within the database.
That's all; now the IDB has all of the memory ranges properly loaded. The clean IDB can be found here.
I only have a few notes on the process of statically reverse engineering this particular binary. That's because, for the most part, I used the same process as I would while statically reverse engineering any binary on any architecture. In particular, I followed the same procedure that I teach in my static reverse engineering training classes. The whole process took 30-40 minutes. You can find the final IDB here.
Reset Vector
It's often useful to know where execution begins when a system or program executes. For embedded devices, the "system entrypoint" is often held as a pointer in the system's reset vector. For example, on 16-bit x86, the memory location F000:FFF0 contains the address to which the processor should branch upon reset.
For this binary, I noticed that the final three words in the memory dump -- at addresses 0xFFFA, 0xFFFC, and 0xFFFE -- all contained the value 0x8530, which happens to be near the end of the region with the code in it. It seems likely that this is our entrypoint. I renamed this location BOOTLOC and began reading.

6502 Documentation and Auto Comments
Now my job is to analyze and document 1300 bytes of 6502 code. A slight problem is that I don't know anything in particular about 6502 beyond some tutorials I read years ago. Nevertheless, this was not a major impediment to reverse engineering this binary. Two things helped. First, the Wikibooks web page I had found previously (which had tipped me off that the binary might be 6502) was a reasonably good layman's guide to the instruction set. Whenever I wanted to know more about a particular mnemonic, I searched for it on that page. Most of my questions were answered immediately; a few required me to correlate information from a few different parts within the document. It was good enough that I didn't have to consult any outside sources.
The second feature that helped me was IDA's "auto comments" feature, under Options->General->Auto Comments.
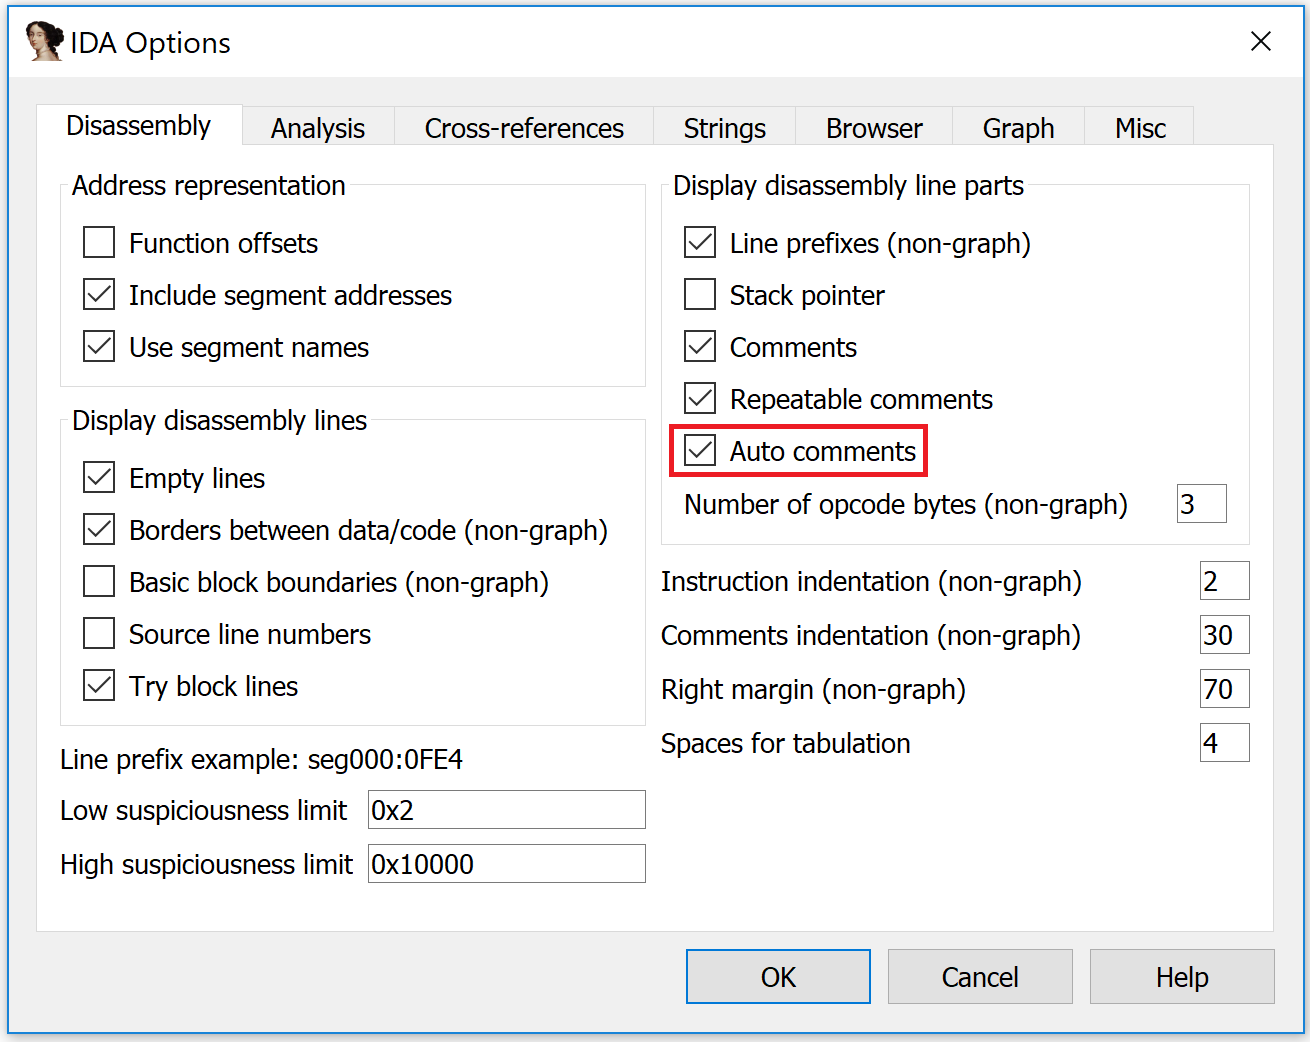
Once enabled, IDA leaves brief one-line descriptions of the mnemonics in the same color that it uses for repeating comments. You can see an example in the screenshot below. Although the comments may confuse you if you don't know 6502, the Wikibooks link above was enough to fill in the missing details, at which point the auto comments assisted in rapidly disassembling the binary.

Disjointed References
One slightly abnormal feature of this binary -- probably 6502 binaries in general -- is the fact that the instructions usually operate on 8-bit values, but the memory addresses are 16-bits. Thus, when the code needs to write a value into memory that is more than 8 bits, it does so one byte at a time. The following screenshot illustrates:

Lines 0x817D-0x8183 write the constant 0x405F into memory (at location 0x80) as a little-endian word. Lines 0x8188-0x818E writes the constant 0x406C to the same location. Lines 0x8193-0x8199 write the constant 0x4081 to the same location.
Those constants stuck out to me as being in the area where the strings are located. Indeed, here's the view of that location:

Thus, the addresses written by the code previously are those of the first three strings making up the textual description of the memory map that is printed when connecting to the system. (The string references also tip us off that the called function likely prints strings.)
Although splitting larger constants into smaller ones is not unique to M6502 -- for example, compiled binaries for most processors with fixed-width instructions do this -- nevertheless, as far as I know, IDA's support for recognizing and recombining these constructs into macroinstructions must be implemented per processor (as part of the processor module). Evidently, the 6502 processor module does not support fusing writes into pseudo-operations. Therefore, we have to resolve these references manually while reverse engineering. Nevertheless, this is not difficult (and we only have about 1300 bytes of code to analyze). Simply use the "G" keyboard shortcut to jump to the referenced locations when you see them. For strings, just copy and paste the string at the referencing location.
Memory-Mapped I/O
When the system prints its memory map upon startup, the region from 0xF000-0xFF00 is labeled "MMIO", which presumably is short for memory-mapped I/O. Memory-mapped I/O addresses are effectively global variables stored in memory. When you write to a memory-mapped I/O location, the data is accessible to other components such as peripherals (i.e., a screen controller or a disk controller). Similarly, peripherals can also share data with the 6502 component via memory-mapped I/O, such as keyboard input or the results of disk I/O.
Reverse engineering the variables in this range is effectively the same as reverse engineering accesses to any global variable, although you must keep in mind that MMIO output locations might never be read, and MMIO input locations might never be written.
Once familiar with the basics of 6502, and the particular points described above, I statically reverse engineered the binary's scant 25 functions.
- Upon boot, the system prints the diagnostic messages we see in the screenshot at the top of this post.
- Next, it loads the message-of-the-day off of the file system (from the file /etc/motd) and prints it.
- Next, it checks mail (under the file /var/mail/spool/atredis) and prints it.
- Finally, it enters into an infinite loop processing user input and dispatching commands.
Reading the code for the final step -- command dispatch -- we can see indeed that "write" and "call" are valid, undocumented commands. The "write" command is ultimately very straightforward: it converts the address and value arguments into hexadecimal, and then write the value to the address. The "call" command is also straightforward, but I found it neat. It creates 6502 code at runtime for a JSR and RTS instruction, which it then invokes. My daily work does not usually involve examining JIT code generation on archaic platforms.

It's been a while since we mentioned it, but recall from the introduction that when we connected to the system, it printed the most recent mail, and dropped a hint about the attachment having been written to disk. Our ultimate goal in reverse engineering this binary is to find and exfiltrate this mystery file from the disk. The message did not actually give us a filename, or anything of that sort. Let's take a closer look at how the system loads and prints files off of the disk, such as the message-of-the-day and the most recent email.
The full details can be found in the IDB, but the process generally works like this:
- PrintMOTD() writes a pointer to "/etc/motd" into a global variable X, then calls Load()
- Load() reads, in a loop, each of the 0x40 disk sectors into a global array Y and compares the first bytes of Y against X
- Once found, Load() returns 1. The contents of the disk sector are still in Y.
- If Load() succeeded, PrintMOTD() calls PrintDiskSectors().
- At this point, the global buffer Y contains not only the name of the file, but also two words; let's call them Z and W. Z indicates the number of the first disk sector which contains the file's contents, and W is the number of sectors that the file occupies.
- PrintDiskSectors() then consults Z and W from within the global array. Beginning at sector Z, it prints the raw contents of the file onto the screen, and repeats for W sectors.
(My analysis at the time was slightly sloppier than the above. I did not fully understand the role of the values I've called Z and W.)
I now had a rough understanding of the mechanism of how files were read from disk and printed to the screen. My understanding also indicated that I could dump the underlying sectors of the disk without needing to know the names of the files comprising those sectors.
In particular: PrintDiskSectors(), at address 0x822C, reads its two arguments from global memory. Those arguments are: 1) Z, i.e., which sector to begin dumping data from, and 2) W, i.e., how many sectors to dump.
And so it was immediately obvious that I could use the undocumented "write" and "call" commands to write whatever I wanted into Z and W and then invoke PrintDiskSectors(). I tried it out in netcat and it worked on the first try -- I was able to dump sector #0.
Thus, I incorporated this functionality into my scripts based on Python's Telnetlib that I had previously used to dump the memory. Since my understanding at the time was a bit off, I ended up with a loop that executed 0x40 times (the number of sectors), which wrote 0x0000 in for Z (i.e., start reading at sector 0), and each iteration of the loop wrote an increasing value into W, starting with 1 and ending with 0x3F. The script would dump the returned data as a binary file, as well as printing it onto the screen. You can find the script here, and its output here.
I let my script run and once it got to the final iteration of the loop, there was a message congratulating me and telling me where to send an email, as well at what the contents should be. I immediately sent an email at 1:35AM, about 80 minutes after I'd first dumped the memory off of the device. Shortly thereafter, I received a personalized email congratulating me on my second-place finish.
