
Thick client assessments come in different flavors. Most of our work is on
consumer applications where consumer means either the customer or an
employee of our client. But these applications usually have network
communications.
When looking at thick client applications from a network traffic perspective, we face two big challenges:
Traffic Attribution or Where does this traffic come from?: How to we identify application's traffic? The operating system (in this case Windows) is running many applications and services. Each of them may have network connectivity.
Proxying Traffic or How do I look view/modify traffic?: This is more challenging and involves capturing, modifying and in a lot of cases decrypting/decoding target application's traffic. This could be as easy as setting up Burp via an application setting (EZ-mode) or as hard as setting up your own access point to capture a device's traffic then developing your own decryption plugin for your proxy tool (good luck).
In this post, I will be talking about the much easier first challenge. I will be
talking about some of the tools and techniques that I use to accomplish this.
This is not a groundbreaking post ;). We will use a simple application, in this
case notepad++.
I am using Windows 7 VM running via VirtualBox. You can probably use anything newer than Windows XP. You can get VMs from Microsoft at http://dev.modern.ie/tools/vms/windows/. These VMs have 90 day activation periods and are for testing different versions of IE but they are enough for our purpose. One downside is the huge virtual disk drive (110GB) that can be shrinked in half. Hard drive is still dynamically located but if you do not watch out, it ends up filling up your hard drive (especially if you are taking snapshots).
- Microsoft Network Monitor (Netmon): http://blogs.technet.com/b/netmon/p/downloads.aspx
- Wireshark: https://www.wireshark.org/download.html
- Process Monitor (Procmon): Part of Microsoft Sysinternals Suite: https://technet.microsoft.com/en-us/sysinternals/bb842062.aspx
I will be using Notepad++ 6.7.9.2. It was the current version at the time of
writing but by the time I got to publishing this post it has been updated to
version 6.8. You can download it from
https://notepad-plus-plus.org/download/v6.7.9.2.html. Install
Notepad++ but make sure to select Auto Updater and Plugin Manager during
installation. Do not run the application at the end of the installation
process.
Run Netmon, Wireshark and Procmon (as Administrator) then run Notepad++.
Procmon Note: Never select Drop Filtered Events in the Filter menu. It
will discard all events that are not shown by your filters. There is no going
back to viewing filtered events.
4.1 Netmon
We can see some traffic in Netmon. See this handy tree view to the left? That is why we are using Netmon.
Click on notepad++.exe in the tree view to view all of its traffic. We can see
that it is communicating with superb-dca2.dl.sourceforge.net and
downloads.sourceforge.net over HTTP gasp. You may observe a different
endpoint depending on your location (because SourceForge).
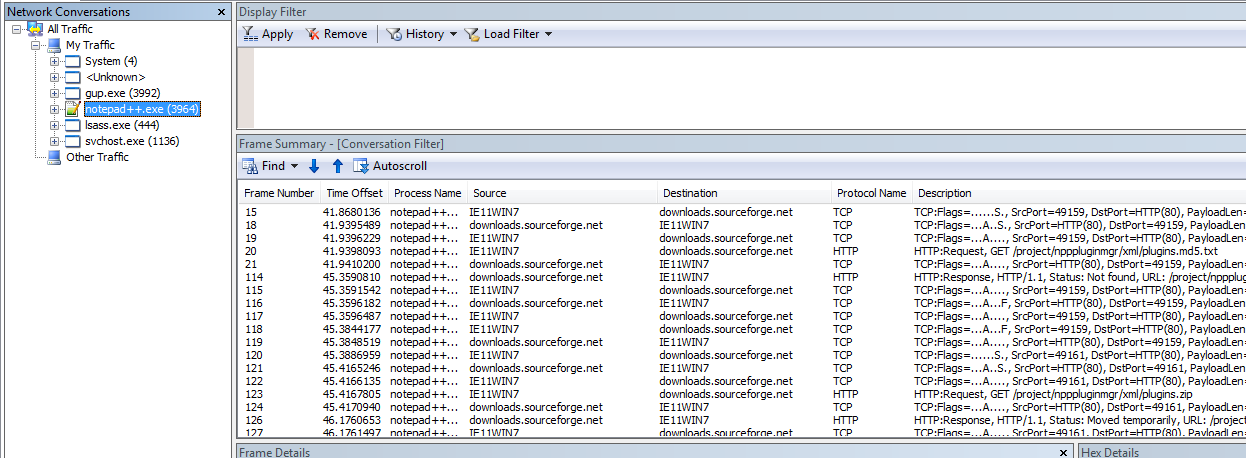
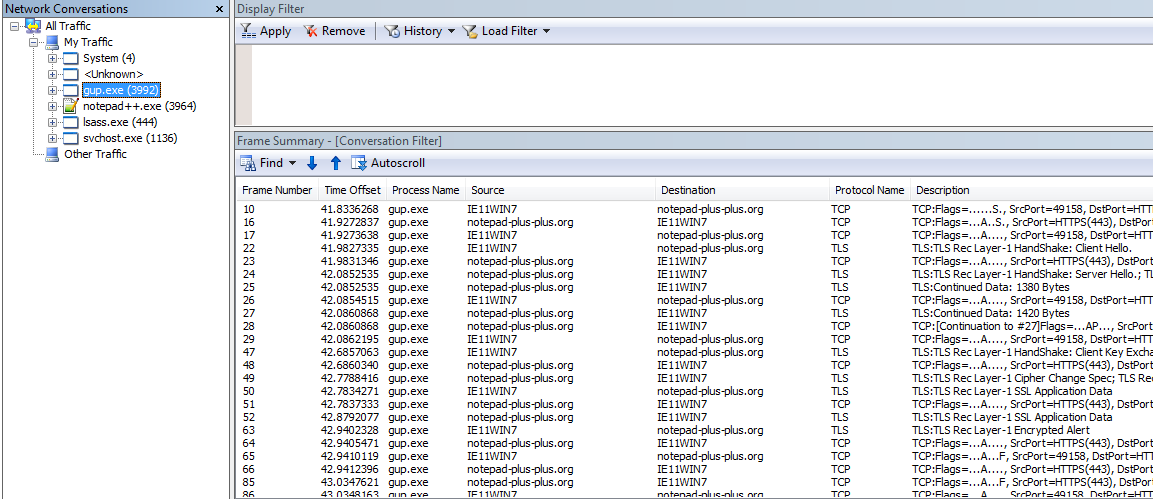
There's another suspicious process up there. Select gup.exe and we can see
it is also related to Notepad++ as it's creating a TLS connection to
notepad-plus-plus.org.
But wait, there's more. There may be traffic that is not correctly attributed due to the way that Netmon identifies traffic. We may be able to find some extra stuff there.
Here's a Catch-22, there may be traffic related to our application that Netmon wasn't able to correlate back to the process but how can we identify it if we do not know the endpoints. We will be using Procmon to compile a more comprehensive endpoint collection later.
4.1.1 How to search in Netmon?
Contains is a filter that allows us to do case-insensitive searches for
strings. For example we can use this filter to search for packets with
destinations containing the string sourceforge. We can use the following
filters (they both do the same thing):
Contains(property.Destination, "sourceforge")Destination.Contains("sourceforge")
Be sure to select All Traffic in the tree-view when applying filters search in
all traffic.
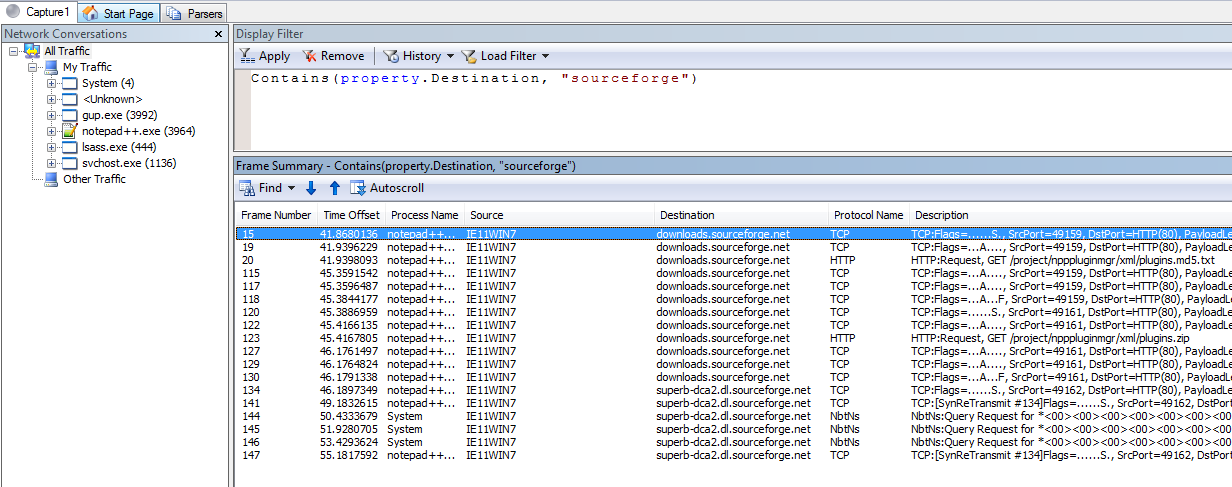
We can search in different columns, one of the most common columns is
property.description. Description is a column with a lot of information and is
usually our best bet. For example if we want to see all GET request we can use
the following filters (again they both do the same thing):
Contains(property.Description,"GET")Description.Contains("GET")

We can also see Windows checking for certificate revocation lists over HTTP zomg.
To search for binary data use ContainsBin. For example to search for the CRLF
binary string in frame data use this filter:
ContainsBin(FrameData, HEX, "0D 0A")
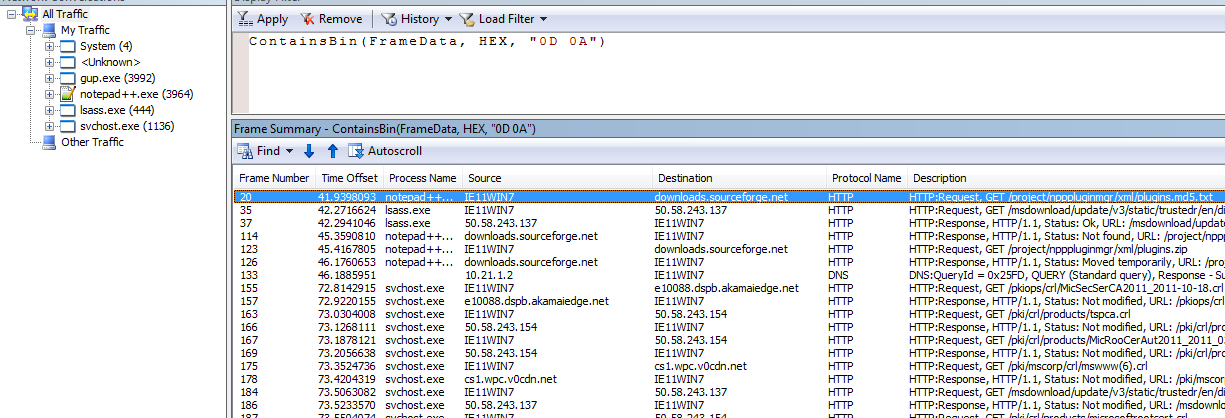
We can also search for strings using ContainsBin by using ASCII. But
remember this search is case-sensitive. To replicate our previous search for
sourceforge we can use the following filter:
ContainsBin(FrameData, ASCII, "sourceforge")
Update May 2020: Hello. This is the future me. I have streamlined the
process a bit. When dealing with TLS (which is common), we can use the following
query just to show the ClientHello packets. We can use the SNI extension in it
to figure out which domains we are talking to.
TLS.TlsRecLayer.TlsRecordLayer.SSLHandshake.HandShake.ClientHello
4.2 Procmon
Procmon does not display traffic but it's a great tool to identify endpoints. Stop the Procmon capture. It is time to add Procmon filters.
I am in the process of writing a longer blog entry about using Procmon but that is for another day. For now we will discuss some filters related to network endpoint discovery.
Procmon has a lot of filters but we will be using only a few of them. The first
filter is ProcessName. Using this filter we can see only events belonging to
specific process(es). Select Filter from the Filter menu or press Ctrl+L. Now
create this filter ProcessName is Notepad++.exe. Note that Procmon will show
you all processes with events in the drop down menu.
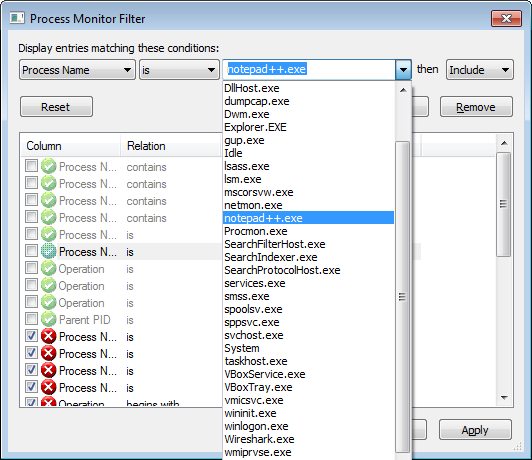
Update May 2020: An easier way of doing this is to use the Tools > Process
Tree feature of procmon. Then we can select the program, right-click and add it
(and its children to the filter). This is quicker and more accurate. The
downside is that it uses pid so the filter is not reusable for other sessions.
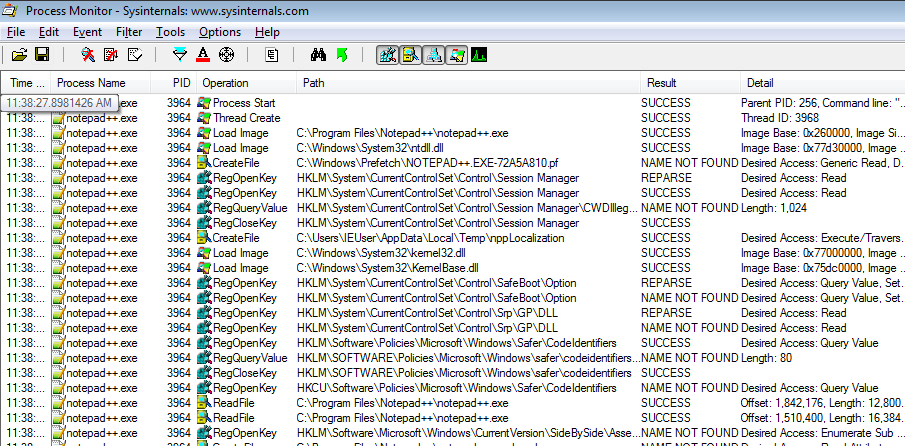
And we can see all events for notepad++.exe in Procmon. Take a note of
ProcessID (PID) for notepad++.exe. In this case PID is 3964.
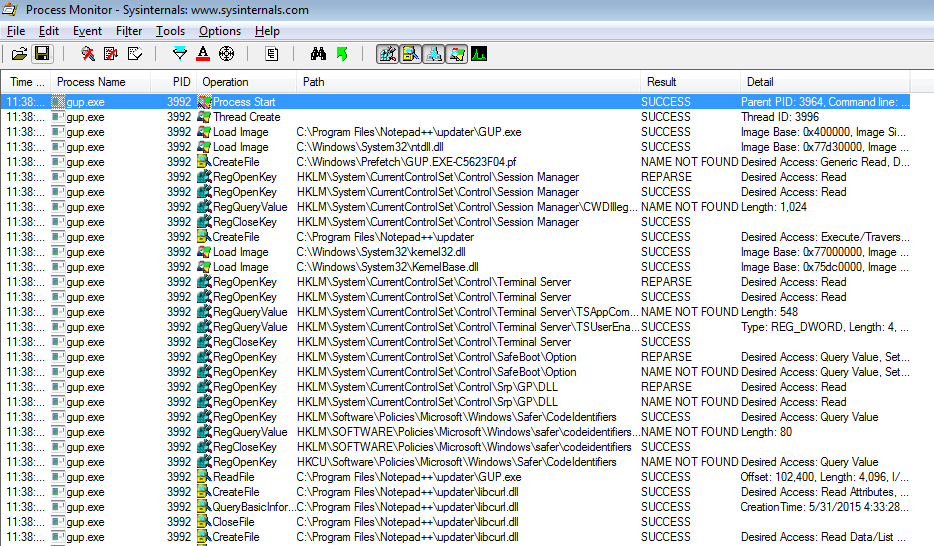
But we want to look at spawned processes too. Let's remove this filter and find
all child processes for notepad++.exe using another filter. The new filter is
Parent PID is 3964and it will show captured events for gup.exe.
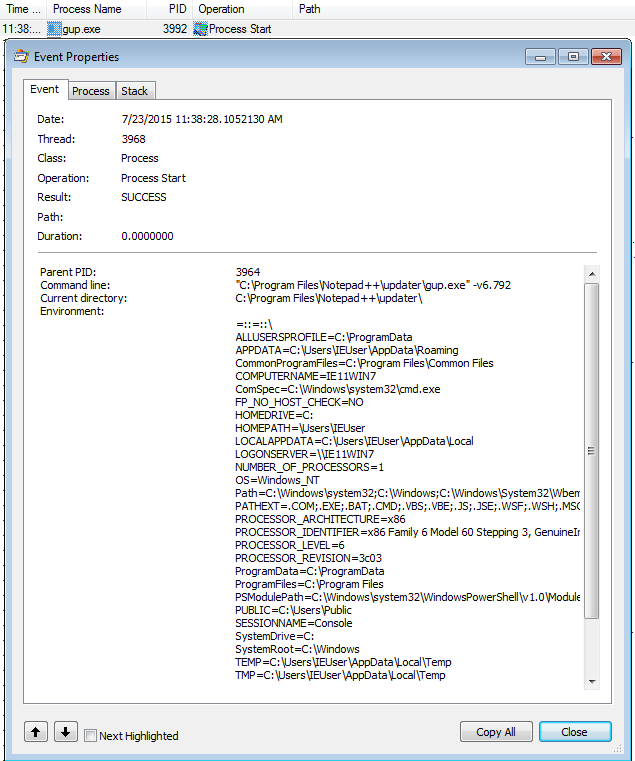
Double-click on the first line (Process Start) to view command line parameters
and other details for gup.exe. Note that the gup.exe application was ran
with parameter -v6.792 (version of Notepad++). So theoretically we can pretend
that we are any version. It would be nice to look at this request and play with
it.
An alternate way to get the same results is to use these two filter:
ProcessName is notepad++.exeOperation is Process Create
If we want to make sure that we have identified all processes, we have to go one
level deeper and check if gup.exe spawned any other processes.
We have two options:
ProcessName is gup.exeandOperation is Process CreateParent PID is 3992(pid ofgup.exe)
But as expected both filters return nothing. gup.exe did not spawn anything.
Now we can add both notepad++.exe and gup.exe as filters to view all events
related to our application in Procmon.
In order to watch network traffic we can use the handy Operation is TCP Send
filter. Note there are other operations (i.e. UDP ones). TCP Connect will also
work if you just want endpoints and less noise.
We use the following filters:
ProcessName is notepad++.exeProcessName is gup.exeOperation is TCP SendOperation is TCP Connect

Update May 2020: We can filter network activity by using the small buttons
in the middle of the toolbar. We can have registry, file, network, and Windows
activity. In this case instead of filtering by TCP Connect/Send we can use
that. We can also use Tools > Network Summary to see all the connection
endpoints.
We have already seen downloads.sourceforge.net but ns378545.ip-91-121-64.eu
is new.
If we ping it, we can see that the corresponding IP address is 91.121.64.34.
We can filter the results in Netmon by using this filter IPv4.Address ==
91.121.64.34 to view traffic related to his IP address.
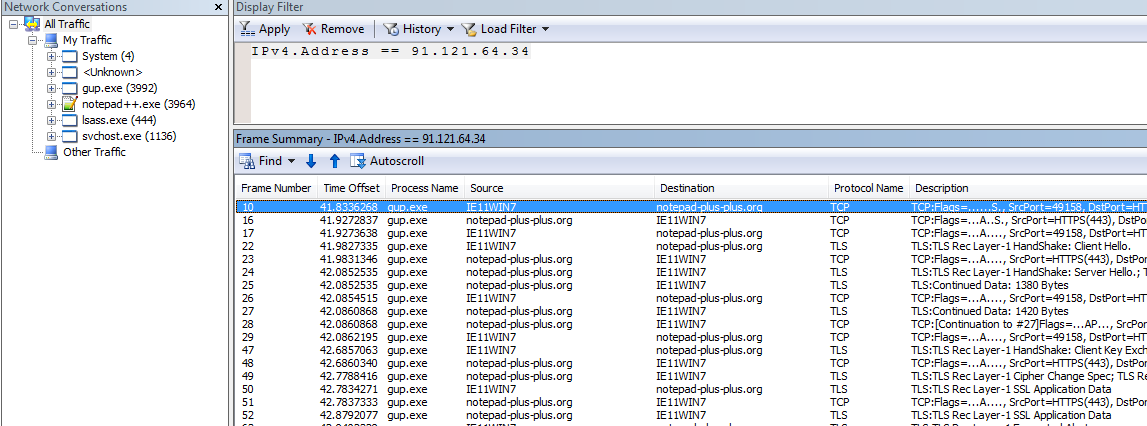
It is notepad-plus-plus.org. Try pinging notepad-plus-plus.org to get 91.121.64.34.
That was easy wasn't it?
What did we do? We used Netmon and Procmon to identify the endpoints that an specific application communicates with and isolate traffic belonging to that application. I told you this is nothing ground breaking.
But what about Microsoft Message Analyzer (MMA)?
It is a good tool. But I do not like its UI but I saw an interesting feature in it to decrypt SSL traffic. I will be looking at that feature soon. It is also much more resource intensive than Netmon.
For more information: http://blogs.technet.com/b/messageanalyzer/archive/2015/06/08/process-tracking-with-message-analyzer.aspx
But I want to use Wireshark
Sure, go ahead. Use Procmon and filters to identify the endpoints and then add filters in Wireshark. Another good thing is that Netmon's export format (*.cap files) can be opened in Wireshark. If you prefer Wireshark's UI, you can isolate traffic by process in Netmon, save it and then open the resulting cap file in Wireshark.
Where are DNS requests? I do not see them in process traffic in Netmon
Select all traffic and use the filter DNS. Due to the way Netmon associates
traffic with processes, DNS requests may be in Unknown or System.

Note that while we had a DNS query for superb-dca2.dl.sourceforge.net, we
never connected to it so we did not see a TCP Connect event for it in Procmon.
Run the tools again and install a plugin. This can be accomplished by going to
Plugins > Plugin Manager > Show Plugin Manager. Try to locate the endpoints
and traffic in this case. See what process is spawned by notepad++.exe this
time.
This time, it will not be as easy as last time because Netmon did not associate all packets with the process but you can find the endpoints via Procmon and filter them in Netmon.
I hope this was useful. If you have any questions, you know where to find me.
如有侵权请联系:admin#unsafe.sh