On and off this past year, I’ve been fooling around with a program called Topfew (GitHub link), blogging about it in Topfew fun and More Topfew Fun. I’ve just finished adding a few nifty features and making it much faster; I’m here today first to say what’s new, and then to think out loud about concurrent data processing, Go vs Rust, and Amdahl’s Law, of which I have a really nice graphical representation. Apologies because this is kind of long, but I suspect that most people who are interested in either are interested in both.
Reminder ·
What Topfew does is replace the sort | uniq -c | sort -rn | head pipeline that you use to do things like find the most
popular API call or API caller by ploughing through a logfile.
When last we spoke… · I had a Topfew implementation in the Go language running fine, then Dirkjan Ochtman implemented it in Rust, and his code ran several times faster than mine, which annoyed me. So I did a bunch more optimizations and claimed to have caught up, but I was wrong, for which I apologize to Dirkjan — I hadn’t pulled the most recent version of his code.
One of the big reasons Dirkjan’s version was faster was that he read the input file in parallel in segments, which is a good way to get data processed faster on modern multi-core processors. Assuming, of course, that your I/O path has good concurrency support, which it might or might not.
So I finally got around to implementing that and sure enough, runtimes are way down. But on reasonable benchmarks, the Rust version is still faster. How much? Well, that depends. In any case both are pleasingly fast. I’ll get into the benchmarking details later, and the interesting question of why the Rust runs faster, and whether the difference is practically meaningful. But first…
Is parallel I/O any use? · Processing the file in parallel gets the job done really a lot faster. But I wasn’t convinced that it was even useful. Because on the many occasions when I’ve slogged away trying to extract useful truth from big honkin’ log files, I almost always have to start with a pipeline full of grep and sed calls to zero in on the records I care about before I can start computing the high occurrence counts.
So, suppose I want to look in my Apache logfile to find out which files are being fetched most often by the popular robots, I’d use something like this:
egrep 'googlebot|bingbot|Twitterbot' access_log | \
    awk ' {print $7}' | sort | uniq -c | sort -rn | head
Or, now that I have Topfew:
egrep 'googlebot|bingbot|Twitterbot' access_log | tf -f 7Which is faster than the sort chain but there’s no chance to parallelize processing standard input. Then the lightbulb went on…
If -f 1 stands in for awk ' { print $1}' and distributes that
work out for parallel processing, why shouldn’t I have -g for grep and -v for grep -v and
-s for sed?
Topfew by example ·
To find the IP address that most commonly hits your web site, given an Apache logfile named access_log:
tf -f 1 access_logDo the same, but exclude high-traffic bots. The -v option
has the effect of grep -v.
tf -f 1 -v googlebot -v bingbot(omittingaccess_log)
The opposite; what files are the bots fetching? As you have probably guessed, -g is like grep.
tf -f 7 -g 'googlebot|bingbot|Twitterbot'Most popular IP addresses from May 2020.
tf -f 1 -g '\[../May/2020'Let’s rank the hours of the day by how much request traffic they get.
tf -f 4 -s "\\[[^:]*:" "" -s ':.*$' '' -n 24So Topfew distributes all that filtering and stream-editing out and runs it in parallel, since it’s all independent, and then pumps
it over (mutexed, heavily bufffered) to the (necessarily) single thread that does the top-few counting. All of the above run dramatically faster than their
shell-pipeline equivalents. And they weren’t exactly rocket science to build; Go has a perfectly decent regexp library that even
has a regexp.ReplaceAll call that does the sed stuff for you.
I found that getting the regular expressions right was tricky, so Topfew also has a --sample option that
prints out what amounts to a debug stream showing which records it’s accepting and rejecting, and how the keys are being
stream-edited.
Almost ready for prime time · This is now a useful tool, for me anyhow. It’s replaced the shell pipeline that I use to see what’s popular in the blog this week. The version on github right now is pretty well-tested and seems to work fine; if you spend much time doing what at AWS we used to call log-diving, you might want to grab it off GitHub.
In the near future I’m going to use GoReleaser so it’ll be easier to pick up from whatever your usual tool depot is. And until then, I reserve the right to change option names and so on.
On the other hand, Dirkjan may be motivated to expand his Rust version, which would probably be faster. But, as I’m about to argue, the speedup may not be meaningful in production.
Open questions · There are plenty.
Why is Rust faster than Go?
How do you measure performance, anyhow…
… and how do you profile Go?
Shouldn’t you use mmap?
What does Gene Amdahl think about concurrency, and does Topfew agree?
Didn’t you do all this work a dozen years ago?
Which I’ll take out of order.
How to measure performance? · I’m using a 3.1GB file containing 13.3 million lines of Apache logfile, half from 2007 and half from 2020. The 2020 content is interesting because it includes the logs from around my Amazon rage-quit post, which was fetched more than everything else put together for several weeks in a row; so the data is usefully non-uniform.
The thing that makes benchmarking difficult is that this kind of thing is obviously I/O-limited. And after you’ve run the benchmark a few times, the data’s migrated into memory via filesystem caching. My Mac has 32G of RAM so this happens pretty quick.
So what I did was just embrace this by doing a few setup runs before I started measuring anything, until the runtimes stabilized and presumably little to no disk I/O is involved. This means that my results will not replicate your experience when you point Topfew at your own huge logfile which it actually has to read off disk. But the technique does allow me to focus in on, and optimize, the actual compute.
How do you profile Go? · Go comes with a built-in profiler called “pprof”. You may have noticed that the previous sentence does not contain a link, because the current state of pprof documentation is miserable. The overwhelming googlejuice favorite is Profiling Go Programs from the Golang blog in 2011. It tells you lots of useful things, but the first thing you notice is that the pprof output you see in 2021 looks nothing like what that blog describes.
You have to instrument your code to write profile data, which is easy and seems to cause shockingly little runtime slowdown. Then you can get it to provide a call graph either as a PDF file or in-browser via its own built-in HTTP server. I actually prefer the PDF because the Web presentation has hair-trigger pan/zoom response to the point that I have trouble navigating to the part of the graph I want to look at.
While I’m having trouble figuring out what some of the numbers mean, I think the output is saying something that’s useful; you can be the judge a little further in.
Why is Rust faster? ·
Let’s start by looking at the simplest possible case, scanning the whole log to figure out which URL was retrieved the
most. The required argument is the same on both sides: -f 7. Here is output from typical runs of the current Topfew
and Dirkjan’s Rust code.
  Go: 11.01s user 2.18s system  668% cpu 1.973 total
Rust: 10.85s user 1.42s system 1143% cpu 1.073 total
The two things that stick out is that Rust is getting better concurrency and using less system time. This Mac has eight two-thread cores, so neither implementation is maxing it out. Let’s use pprof to see what’s happening inside the Go code. BTW if someone wants to look at my pprof output and explain how I’m woefully misusing it, ping me and I’ll send it over.
The profiling run’s numbers: 11.97s user 2.76s system 634% cpu 2.324 total; like I said, profiling Go seems to
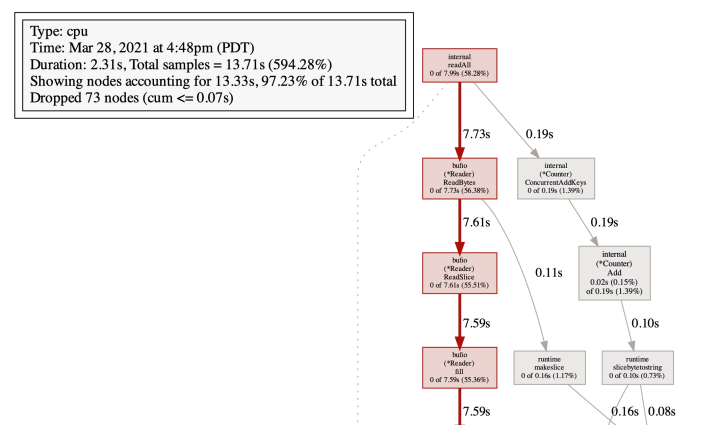
be pretty cheap. Anyhow, that’s 14.73 seconds of compute between user and system. The PDF of the code graph is too huge to put
inline, but here it is if you want a look. I’ll excerpt screenshots. First, here’s one
from near the top:
So, over half the time is in ReadBytes (Go’s equivalent of ReadLine); if you follow that
call-chain down, at the bottom is syscall, which consumes 55.36%. I’m not sure if these numbers are elapsed time or
compute time and I’m having trouble finding help in the docs.
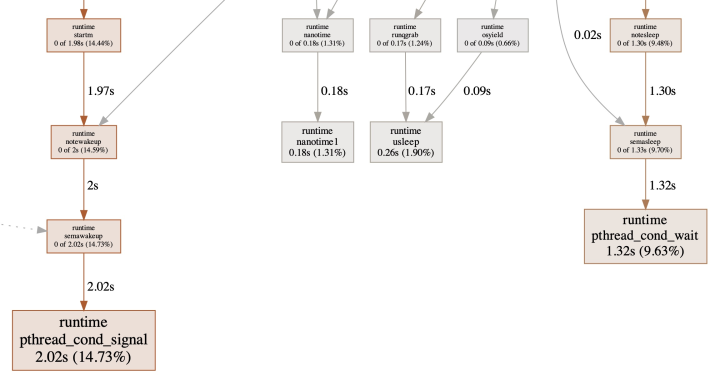
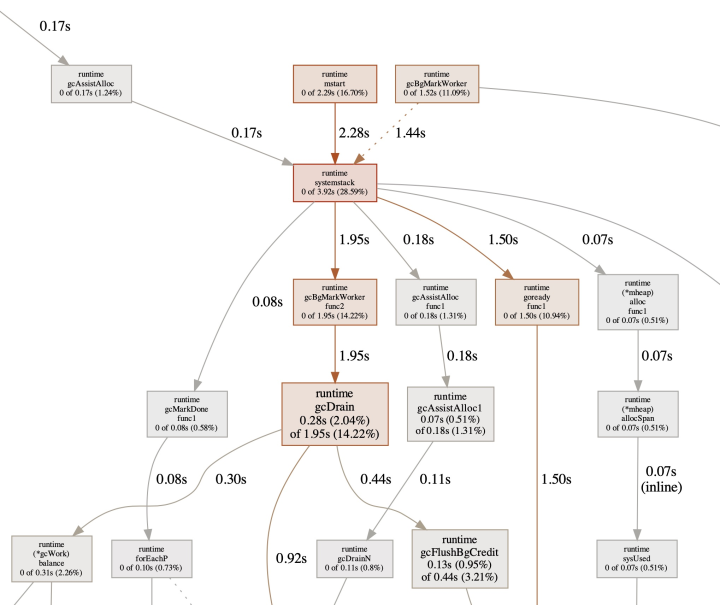
Moving down to the middle of the call graph:
It’s complicated, but I think the message is that Go is putting quite a bit of work into memory management and garbage collection. Which isn’t surprising, since this task is a garbage fountain, reading millions of records and keeping hardly any of that data around.
The amount of actual garbage-collection time isn’t that big, but I also wonder how single-threaded it is, because as we’ll see below, that matters a lot.
Finally, down near the bottom of the graph:
The meaning of this is not obvious to me, but the file-reading threads use the Lock() and Unlock()
calls from Go’s sync.Mutex to mediate access to the occurrence-counting thread. So what are those 2.02s and 1.32sec
numbers down at the bottom of a “cpu” graph? Is the implementation spending three and a half seconds implementing mutex?
You may notice that I haven’t mentioned application code. That code, for pulling out the seventh field and tracking the top-occurring keys, seems to contribute less than 2% of the total time reported.
My guesses · Clearly, I need to do more work on making better use of pprof. But based on my initial research, I am left with the suspicions that Rust buffers I/O better (less system time), enjoys the benefits of forcing memory management onto the user, and (maybe) has a more efficient wait/signal primitive. No smoking pistols here.
I’m reminded of an internal argument at AWS involving a bunch of Principal Engineers about which language to use for something, and a Really Smart Person who I respect a lot said “Eh, if you can afford GC latency use Go, and if you can’t, use Rust.”
Shouldn’t you use mmap? · Don’t think so. I tried it on a few different systems and mmap was not noticeably faster than just reading the file. Given the dictum that “disk is the new tape”, I bet modern filesystems are really super-optimized at sweeping sequentially through files, which is what Topfew by definition has to do.
What does Gene Amdahl think about concurrency, and does Topfew agree? · Amdahl’s Law says that for every computing task, some parts can be parallelized and some can’t. So the amount of speedup you can get by cranking the concurrency is limited by that. Suppose that 50% of your job has to be single-threaded: Then even with infinite concurrency, you can never even double the overall speed.
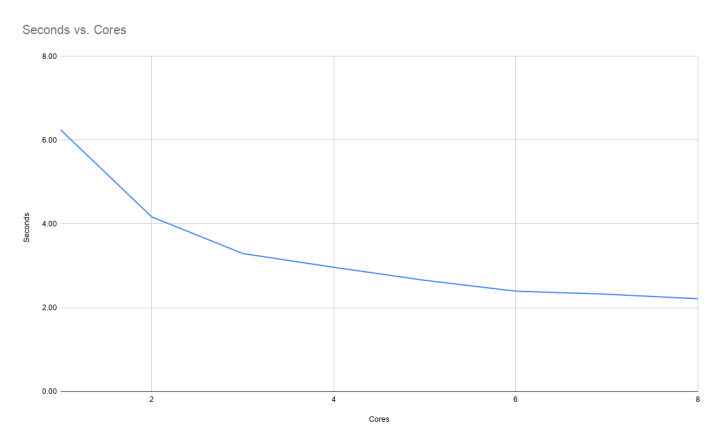
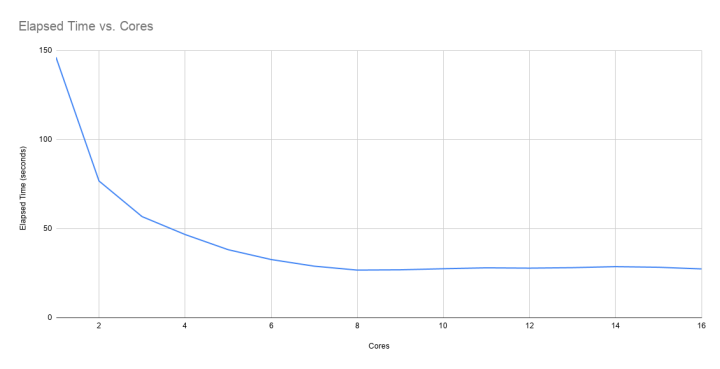
For Topfew, my measurements suggest that the single-threaded part — finding top occurrence counts — is fairly small compared to the task of reading and filtering the data. Here’s a graph of a simple Topfew run with a bunch of different concurrency fan-outs.
Which says: Concurrency helps, but only up to a point. The graph stops at eight because that’s where the runtime stopped decreasing.
Let’s really dig into Amdahl’s Law. We need to increase the compute load. We’ll run that query that focuses on the popular bots. First of all I did it the old-fashioned way:
egrep 'googlebot|bingbot|Twitterbot' test/data/big | bin/tf -f 7
    90.82s user 1.16s system 99% cpu 1:32.48 total
Interestingly, that regexp turns out to be pretty hard work. There was 1:32:48 elapsed, and the egrep user CPU
time was 1:31. So the Topfew time vanished in the static. Note that we only used 99% of one CPU. Now let’s parallelize, step by
step.
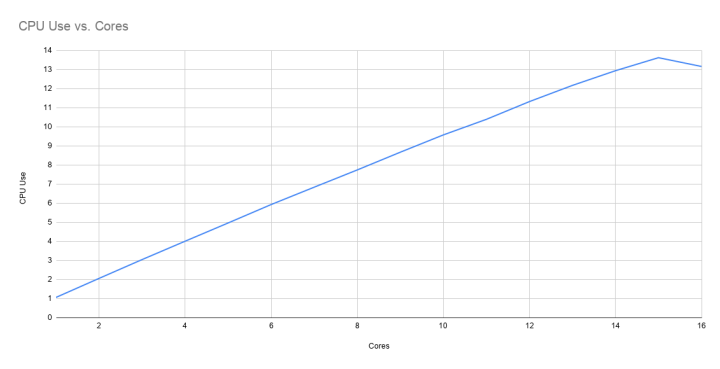
Look at that! As I increase the number of file segments to be scanned in parallel, the reported CPU usage goes up linearly until you get to about eight (reported: 774%CPU) then starts to fall off gently until it maxes out at about 13½ effective CPUs. Two questions: Why does it start to fall off, and what does the total elapsed time for the job look like?
Paging Dr. Amdahl, please! This is crystal-clear. You can tie up most of the CPUs the box you’re running on has, but eventually your runtime is hard-limited by the part of the problem that’s single-threaded. The reason this example works so well is that the grep-for-bots throws away about 98.5% of the lines in the file, so the top-occurrences counter is doing almost no meaningful work, compared to the heavy lifting by the regexp appliers.
That also explains why the effective-CPU-usage never gets up much past 13; the threads can regexp through the file segments in parallel, but eventually there’ll be more and more waiting for the single-threaded part of the system to catch up.
And exactly what is the single-threaded part of the system? Well, my own payload code that counts occurrences. But Go brings along a pretty considerable runtime that helps most notably with garbage collection but also with I/O and other stuff. Inevitably, some proportion of it is going to have to be single-threaded. I wonder how much of the single-threaded part is application code and how much is Go runtime?
I fantasize a runtime dashboard that has pie charts for each of the 16 CPUs showing how much of their time is going into regexp bashing, how much into occurrence counting, how much into Go runtime, and how much into operating-system support. One can dream.
How many cores should you use? ·
It turns out that in Go there’s this API called runtime.NumCPU() that returns how many processors Go thinks
it’s running on; it returns 16 on my Mac. So by default, Topfew divides the file into that many segments. Which, if you look at
the bottom graph above,
is suboptimal. It doesn’t worsen the elapsed time, but it does burn a bunch of extra CPU to no useful effect. Topfew has a
-w (or --width) option to let you specify how many file segments to process concurrently; maybe you can
do better?
I think the best answer is going to depend, not just on how many CPUs you have, but on what kind of CPUs they are, and (maybe more important) what kind of storage you’re reading, how many paths it has into memory, how well its controller interleaves requests, and so on. Not to mention RAM caching strategy and other things I’m not smart enough to know about.
Didn’t you do all this work a dozen years ago? · Well, kind of. Back in the day when I was working for Sun and we were trying to sell the T-series SPARC computers which weren’t that fast but had good memory controllers and loads of of CPU threads, I did a whole bunch of research and blogging on concurrent data processing; see Concur.next and The Wide Finder Project. Just now I glanced back at those (wow, that was a lot of work!) and to some extent this article revisits that territory. Which is OK by me.
Next? · Well, there are a few obvious features you could add to Topfew, for example custom field separators. But at this point I’m more interested in concurrency and Amdahl’s law and so on. I’ve almost inevitably missed a few important things in this fragment and I’m fairly confident the community will correct me.
Looking forward to that.
如有侵权请联系:admin#unsafe.sh
